Identifying important stages of crop growth and development (crop phenology) for in-season management and harvest dates is important with melon (Cucumis melo ‘reticulatus’ L.) crop production. To monitor and predict plant development it is best to measure actual thermal conditions in the plant’s environment. Plant growth is a direct response to temperature and environmental conditions. Measuring “thermal time” is a more reliable measure and predictive tool for plant development as opposed to a calendar.
Thus far, 2026 has been an abnormally warm year for Arizona and the desert Southwest. Accordingly, crop development has been accelerated by conventional calendars but closely following the thermal calendars that plants respond to.
Various forms of temperature measurements and units commonly referred to as heat units (HU), growing degree units (GDU), or growing degree days (GDD) have been utilized in numerous studies to predict phenological events for many crop plants (Baskerville and Emin, 1969; Brown, 1989; Baker and Reddy, 2001; and Soto, 2012). A graphical depiction of HU computation using the single sine curve procedure is presented in Figure 1 (Brown, 1989).
A little over twenty-five years ago we began working on the development and testing of a phenology model for desert cantaloupe production for Arizona conditions. The basic cantaloupe phenology model is shown in Figure 2 (Silvertooth, 2003; Soto et al., 2006; and Soto, 2012). Since cantaloupes are a warm season crop, we use the 86/55 ºF thresholds for phenological tracking.
This melon crop phenology model was developed under fully irrigated and well-managed conditions, primarily in the lower Colorado River Valley. That is important since non-irrigated fields are more likely to experience water stress, which significantly disrupts crop development patterns.
Key stages of growth or “guideposts” indicated in Figure 2 represent general average or “target” values that are subject to a slight degree of natural variation, which is normal.
Referring to the data from the Arizona Meteorological Network (AZMET) and several locations in the Yuma area, the HU accumulations (86/55 ºF thresholds) from 1 January 2026 to a set of four possible 2026 planting dates are listed in Table 1. The HU accumulations from 1 January to 1 April 2026 are listed in Table 2.
The HU accumulations after planting (HUAP) for these four possible planting dates for three Yuma area locations to 1 April 2026 are shown in Table 3. The HUAP values in Table 3 are simply the difference between the values in Tables 1 and 2. An example for the Yuma Valley (UA Yuma Ag Center), 15 January 2026 planting date is: HU 1318- 95 HU = 1223 HUAP.
It is rather easy to test and evaluate this crop phenology model in the field under various planting dates, varieties, and conditions. Tracking HUs and reference to this phenology model (Figure 2) can serve as a check for melon crop development in the field. Based on the estimates in Table 3, the earliest planting dates are ready or close to crown fruit harvest and later planting dates are for small golf-ball and slightly large sized melons. Calendar wise, this is rather early but right on track based on seasonal HU accumulations.
Note: Yuma AZMET site is at the University of Arizona Yuma Agricultural Center. The North Gila AZMET site is located west of the Laguna Dam Road near County 3E. The Roll site is located near E. County 8th Street and S. Avenue 35E.References:
Baker, J.T., and V.R. Reddy. 2001. Temperature effects on phenological development and yield of muskmelon. Annals of Botany. 87:605-613.
Baskerville, G.L., and P. Emin. 1969. Rapid estimation of heat accumulation from maximum and minimum temperatures. Ecology 50:514-517.
Brown, P. W. 1989. Heat units. Ariz. Coop. Ext. Bull. 8915. Univ. of Arizona, Tucson, AZ.
Silvertooth, J.C. 2003. Nutrient uptake in irrigated cantaloupes. Annual meeting, ASA-CSSA-SSSA, Denver, CO.
Simonne, A., E. Simonne, R. Boozer, and J. Pitts. 1998. A matter of taste: Consumer preferences studies identify favorite small melon varieties. Highlights of Agricultural Research. 45(2):7-9.
Soto, R. O. 2012. Crop phenology and dry matter accumulation and portioning for irrigated spring cantaloupes in the desert Southwest. Ph.D. Dissertation, Department of Soil, Water and Environmental Science, University of Arizona.
Soto-Ortiz, R., J.C. Silvertooth, and A. Galadima. 2006. Nutrient uptake patterns in irrigated melons (Cucumis melo L.). Annual Meetings, ASA-CSSA-SSSA, Indianapolis, IN.

Table 1. Heat unit accumulations (86/55 ºF thresholds) after 1 January 2026 on four
possible 2026 planting dates utilizing Arizona Meteorological Network (AZMET) data for
each representative site.

Table 2. Heat unit accumulations (86/55 ºF thresholds) after 1 January 2025 on 12 April
2026 utilizing Arizona Meteorological Network (AZMET) data for each representative site
in the Yuma Valley, North Gila Valley, and Roll.

Table 3. Heat unit accumulations (86/55 ºF thresholds) after planting (HUAP) as of 10
April 2026 from four possible 2026 planting dates and three sites in the Yuma area
utilizing Arizona Meteorological Network (AZMET) data for each representative site.
Note: the values in Table 3 are determined by taking the difference between the HUs for each representative site and four planting dates in Tables 1 and 2.
Yuma Valley: https://azmet.arizona.edu/application-areas/heat-units/station-level-summaries/az02
Yuma North Gila: https://azmet.arizona.edu/application-areas/heat-units/station-level-summaries/az14
Roll: https://azmet.arizona.edu/application-areas/heat-units/station-level-summaries/az24

Figure 1. Graphical depiction of heat unit computation using the single sine curve procedure. A sine curve is fit through the daily maximum and minimum temperatures to recreate the daily temperature cycle. The upper and lower temperature thresholds for growth and development are then superimposed on the figure. Mathematical integration is then used to measure the area bounded by the sine cure and the two temperature thresholds (grey area). (Brown, 1989)

Figure 2. Heat Units Accumulated After Planting (HUAP, 86/55 oF)

Galls observed on the stems of begonias submitted to the clinic
Recently, we received a submission of begonias to the Yuma Plant Health Clinic that immediately presented a diagnostic challenge. At first glance, the symptoms seemed to point toward a familiar set of suspects. The plants had developed severe swelling of the stems, symptoms characteristic of physiological oedema or bacterial Agrobacterium-associated crown gall. But, as is often the case in plant diagnostics, appearances can be deceiving.
The begonias had been grown indoors in high-humidity terrariums and planter boxes. The symptoms were not associated with a particular begonia variety, nor were they consistently expressed across all plantings or cuttings. When the plants were removed from their planting substrate, however, another clue emerged: additional small galls were scattered throughout the root systems of those plants also showing the stem swellings. That observation changed the diagnostic picture considerably.

Galls observed on the roots of begonias submitted to the clinic
Dissection of both the swollen stem tissue and the roots revealed an abundance of eggs, juveniles, mature female nematodes, and giant cells, a classic signature of root-knot nematode (RKN) infection. Root-knot nematodes belong to the genus Meloidogyne, a group of microscopic roundworms that are among the most important plant-parasitic nematodes worldwide. Their typical symptom is familiar to many resulting in the formation of characteristic galls on roots.
These galls are not simply a physical wound created by the nematodes. Rather, RKNs actively manipulate their host. During infection, the nematodes secrete salivary compounds that alter plant growth and development, effectively hijacking normal cellular processes and redirecting them toward the formation of specialized feeding structures known as giant cells.
These giant cells become a nutrient-rich feeding site for the developing and mature nematodes. In doing so, the nematode establishes a sustained drain on the plant's resources. As infection progresses, the resulting disruption to the root system can interfere with nutrient acquisition and water uptake. Aboveground, this typically translates into stunted growth, declining foliage, wilting, and, in severe infestations, plant death. With more than 3,000 plant species reported as hosts to different root-knot nematode species worldwide, including many field and vegetable crops, the annual impact of these pathogens is enormous. Much research has been done on RKN in various crops, and reports of stem swellings occurring naturally is almost non-existent.
Yet the begonia case raises an especially interesting question: Why did a pathogen best known for producing root galls appear to be responsible for such dramatic swelling in the stems? This is where the environment becomes an essential part of the diagnosis.
The symptom is not the pathogen. It is a reaction of the plant to the presence of a pathogen. One of the most important principles in plant pathological diagnostics is that the same pathogen does not necessarily produce the same symptom under every set of environmental conditions. Likewise, similar symptoms can arise from entirely different causes.
Temperature, humidity, water availability, substrate conditions, light, nutrition, plant age, and even the way a plant is cultivated can all influence how a disease develops and how its symptoms are expressed. In other words, the symptom we see is the product of an interaction between the host, the pathogen, and the environment. Change any one of those components, and the resulting disease can change dramatically. This recent begonia case is a particularly useful reminder of this principle.
Root-knot nematodes are well known for their belowground symptoms, but reports of rare and isolated cases of infections on aerial plant tissues, including stems, leaves, and flowers, are reported in only one publicly available extension bulletin from 1985. These symptoms remain unusual and have rarely been observed unless aerial tissues are artificially inoculated, and they have only been documented in a limited number of hosts.
So, when confronted with the unusual stem symptoms in a begonia, it would be easy to focus exclusively on the appearance of the tissue and pursue diagnoses such as oedema or crown gall. These plants were being cultivated in enclosed, high-humidity conditions, where moisture levels around the plant were substantially different from those experienced by a plant growing in a more open environment. Such conditions can alter transpiration rates, water movement, tissue hydration, pathogen development, and the plant's own physiological responses. They also give rise to the wet, humid conditions necessary for oedema to develop or crown gall bacteria to thrive.
The small root galls were an important clue. Microscopic examination then provided the confirmation: eggs, juveniles, mature females, and the characteristic giant cells associated with root-knot nematode feeding. These signs of RKN were found in both the root and stem swellings. Understanding the environment in which the hosts were being grown, with its high moisture conditions, then provided supporting evidence that the nematodes had favorable environmental conditions to migrate into much higher foliar tissues than is typically seen in RKN infestations and produce an unusual symptom. Swollen galls on the stem told us that something was wrong, and if we relied on the most common culprits associated with this symptom alone, namely oedema or crown gall, we would have gotten the diagnosis wrong.
The begonia case is a fascinating example of how flexible disease expression can be. A pathogen with a reputation for being almost exclusively soilborne and producing galling symptoms on root tissues, under particular host and environmental circumstances, can be associated with symptoms in tissues where we do not ordinarily expect to find them.
Ultimately, environment is not simply a backdrop against which plant disease occurs. It is one of the determinants of how disease develops, how severe it becomes, and critically for anyone trying to ID the pathogenic cause, what it looks like.
If you have any concerns regarding the health of your plants/crops please consider submitting samples to the Yuma Plant Health Clinic for diagnostic service or booking a field visit with me:
Christopher Detranaltes, Ph.D.
Cooperative Extension – Yuma County
Email: cdetranaltes@arizona.edu
Cell: 602-689-7328
6425 W 8th St Yuma, Arizona 85364 – Room 109
At the 2025 Southwest Ag Summit Field Demo a couple of weeks ago, many of the latest technologies were demonstrated in the field. Most were related to pest control. Several of the technologies demonstrated are new to the Yuma, AZ area. The recent technologies presented included two types of high precision spot sprayers for weeding and applying beneficial pesticides (Fig. 1a, Fig. 1b) and an AI based lettuce thinner. Manufacturers stated the technologies will be getting even better/more versatile soon. Both precision spot sprayer companies are developing models for small lettuce so that the machines can also be used for lettuce thinning. Also new was that the AI lettuce thinner technology is being further developed so that the device can be used also be used as a weeder. Several “older” pest control technologies also seemed to garner a lot of interest. These included an implement designed for cultivating high density crops (Fig. 1d), a camera guided cultivator equipped with in-row weeding tools (Fig. 1e) and a field scale drone sprayer (Fig. 1f).
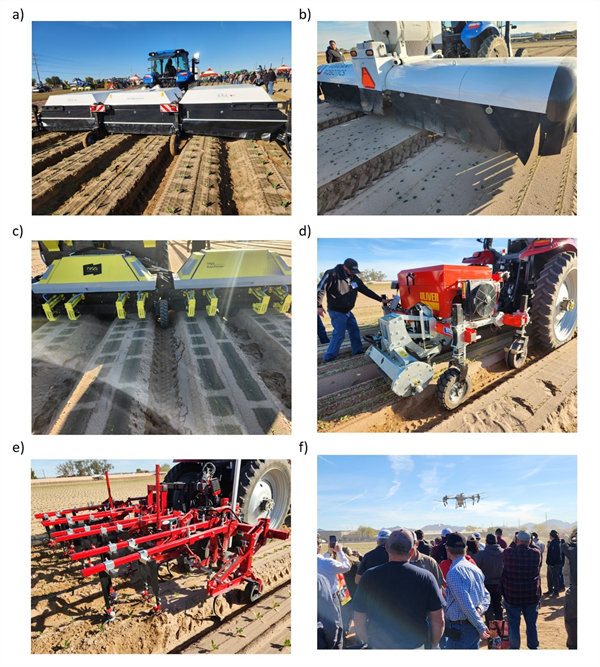
Fig. 1. Newer pest control technologies demonstrated at the 2025 Southwest Ag Summit
Field Demo included a) Ecorobotix1 Ara high precision spot sprayer, b) Verdant Robotics
Sharp Shooter, c) Niqo Robotics AI based lettuce thinner, d) Oliver high density
cultivator, e) Steketee IC Light camera guided cultivator and f) DJI Agras T50 drone
sprayer.
This winter at the Yuma Agricultural Center, we evaluated whether Kerb (pronamide) can be effectively applied through sprinkler irrigation using a custom venturi chemigation unit, rather than a traditional ground sprayer. We also tested whether adding Hydrovant fA improves performance.
This trial was conducted under very heavy Sudan grass pressure and in cloddy seedbed conditions, making it a strong stress test of these programs.
Read the full report HERE
Key Takeaways (14 DAT – Preliminary)
This is a single, unreplicated screening trial. Always follow label directions and consult your PCA before adjusting programs.
Visitors are welcome to walk the plots at YAC.

Figure 1. Early results (14 DAT) show strong goosefoot control with chemigated Kerb
programs.
This trial was made possible through partial funding from the Western IPM Center, with additional support from the University of Arizona Cooperative Extension and industry collaborators. Co-PIs on the project: Macey Keith and Wilfrid Calvin.
Insect pests are constantly adapting to their environment. Over time, they have evolved ways to overcome control tactics. Repeated use of the same insecticides or tactics places strong selection pressure on pest populations. This allows the few individuals that can survive treatments to reproduce, leading to populations that are increasingly difficult to control, a process known as resistance.
Insects can develop resistance in several ways. Some break down insecticides more efficiently or develop changes at the target site that reduce product effectiveness. Others avoid exposure altogether by changing their feeding or movement behavior. In some cases, insects even develop thicker cuticles that slow the absorption of insecticides.
Production practices can influence the rate of resistance development. Large, uniform cropping systems and repeated use of the same control tools reduce opportunities for susceptible insects to persist, accelerating resistance.

Figure 1: Chart illustrating how insecticide resistance develops when
insecticides with the same mode of action (MoA) are used repeatedly
What Should You Do?
An integrated pest management (IPM) approach remains the best defense against resistance.
Key practices include:
Reducing selection pressure is critical. The more intensively a single tactic is used, the faster resistance will develop. A diversified management approach will help extend the life of available tools and improve long-term pest control.
Daytime and nighttime temperatures have risen well above the recent norm, with important implications for crop development, irrigation demand, and pest management.
Yuma Valley has experienced an unusually warm spring pattern since late February 2026. Based on AZMET Yuma Valley station data, daily maximum and minimum air temperatures from January through March 29, 2026, diverged markedly from the 2020–2025 pattern, with the greatest separation occurring during March. In the most recent period, daytime temperatures repeatedly rose into the mid-90s and above 100°F (Figure 1), while nighttime temperatures frequently remained near or above 60°F (Figure 2). Relative to the recent historical pattern, both daytime and nighttime conditions have remained consistently warmer than expected for this point in the production season.
This warming trend is agronomically important because crops respond not only to extreme temperatures but to cumulative thermal exposure over time. When both maximum and minimum temperatures remain elevated for prolonged periods, crop development accelerates, the growing season becomes compressed, and management schedules can shift quickly. In several vegetable production systems, this season’s heat pattern appears to be advancing crop maturity and harvest readiness by as much as three weeks. While earlier harvests may appear favorable at first, such rapid progression often reduces the amount of time the crop has to accumulate biomass and achieve full yield potential.
In desert vegetable systems, crop growth and maturity are strongly linked to heat-unit accumulation. Under warmer-than-normal conditions, crops move more quickly through vegetative development, canopy expansion, and market maturity. However, earlier maturity is not necessarily equivalent to better productivity. Yield depends not only on developmental timing, but also on the duration of active growth. Crops need adequate time to intercept sunlight, expand leaf area, produce carbohydrates, and partition assimilates into the harvestable portion of the plant. When the season is shortened by sustained heat, plants may reach harvest stage before fully developing the biomass needed for optimum size, weight, or quality. The result can be smaller plants, lighter fresh weight, reduced head development, and lower total marketable yield.
Warm nighttime temperatures may be especially important in explaining this response. Plants photosynthesize during the day, but they respire continuously, including throughout the night. When nights remain warm, respiration rates increase, and a larger proportion of the carbohydrates produced during the day is consumed for maintenance rather than retained for growth and yield formation. This reduces carbon-use efficiency and limits dry matter accumulation. In practical terms, the crop may mature earlier while simultaneously losing some of its ability to build harvestable biomass. Warm nights also reduce the recovery period plants normally experience after hot daytime conditions, creating sustained thermal stress across the full 24-hour cycle.
The recent heat pattern is also likely increasing crop water demand. High daytime temperatures elevate evapotranspiration, and warm nights can prolong plant metabolic activity and maintain greater atmospheric demand. As a result, irrigation requirements may now be higher than expected for late March. Fields managed under fixed irrigation intervals may begin to experience short-term moisture deficits if irrigation is not adjusted to current weather conditions and crop demand. Even brief periods of water stress during rapid growth can reduce cell expansion, canopy development, and final yield. At the same time, excessive irrigation in response to heat can create additional problems, including nutrient leaching, fluctuating root-zone aeration, and reduced fertilizer-use efficiency. Under these conditions, irrigation decisions should be based on crop stage, soil moisture status, and weather-based demand rather than on calendar assumptions alone.
From an IPM perspective, abnormal warming may also alter pest pressure and the timing of management decisions. Higher temperatures can accelerate insect development, shorten generation times, and increase the rate of population growth. At the same time, crop phenology is also advancing more quickly, which narrows the window for scouting, threshold-based treatment decisions, and timely intervention. In effect, both the crop and the pest may be moving ahead of schedule. Heat-stressed plants may also be less tolerant of pest injury because they are already operating under shortened growth duration and higher respiratory demand. Under these conditions, pest damage that might otherwise have been manageable under normal spring temperatures could become more economically significant.
Other agronomic practices may also need adjustment. Nutrient demand can shift when crop development accelerates, and fertilizer programs designed around the normal seasonal calendar may no longer align well with actual crop uptake. Harvest logistics may also be affected if multiple planting blocks mature earlier than expected. Labor scheduling, harvest sequencing, cooling, and market timing can all become more difficult when crop development is compressed. Thus, the current warming pattern should be viewed not only as a temperature anomaly but as a whole-system production issue affecting physiology, water management, pest pressure, and field operations.
Bottom line
The abnormal warming pattern that developed in Yuma Valley from late February through March 2026 may be substantially shortening the vegetable production window. Although earlier maturity may move harvest ahead of schedule, the physiological and agronomic costs can be considerable. A compressed season reduces the time available for biomass accumulation, while elevated nighttime temperatures increase respiration and reduce carbon retention. Together, these conditions may lower yield potential, increase irrigation demand, intensify pest management pressure, and complicate agronomic decision-making across the production system.

Figure 1. Daily maximum air temperature recorded at the AZMET Yuma Valley
station from January 1 through March 29, 2026, compared with the 2020–2025
temperature pattern.

Figure 2. Daily minimum air temperature recorded at the AZMET Yuma Valley
station from January 1 through March 29, 2026, compared with the 2020–2025
temperature pattern.
VegIPM Update Vol. 17, Num. 5
March 4, 2026
Results of pheromone and sticky trap catches below!!
Corn earworm: CEW moth activity seen in some areas, but numbers have been low; About average for this time of season.
Beet armyworm: BAW numbers decreased across most locations since last collection. Above average for this time of the season. Historically BAW numbers peak in March/April.
Cabbage looper: Cabbage looper moth activity decreased across most sites since last collection, but remains higher than average for late-February. Historically cabbage looper moth numbers peak in March/April.
Diamondback moth: Adult activity remains steady across most locations. About average for this time of the year.
Whitefly: Adult activity remains low across all locations, about average for this time of year.
Thrips: Thrips adult activity remains steady across locations, about average for this time of year. Expect numbers to continue increasing as temperatures warm up.
Aphids: Winged aphid numbers decreased at most sites since last collection; below average for this time of the year.
Leafminers: Adult leafminer activity remains steady, high numbers seen in Yuma Valley, about average for this time of the season.