Root systems provide the foundation for plant development. At the time of seeding and plant establishment, it is important to monitor and evaluate the newly developing root systems; subsequent plant growth depends on them.
Roots are responsible for all water and nutrient uptake by the plant, and they provide the physical anchoring and support of the plant structure. Each plant and crop species has its own “personality” and growth habits, including root systems. Accordingly, root systems have unique characteristics among plants species.
Young plant roots, particularly at the time of germination and stand establishment, are generally the most sensitive plant part to soil and water salinity. In fact, seedling plant sensitivity to salinity can often be measured by approximately ½ of the tabulated salinity tolerance guidelines.
In general plant root systems constitute 30-50% of the total plant dry matter. When post-harvest plant residues are incorporated into the soil, the root systems provide a significant contribution to that plant material and final carbon (C) contributions to the soil, which is an important factor contributing to soil health.
The first thing a seed develops in the germination process is a primary root that grows downward into the soil. We often refer to this as the “stinger” root that extends from a germinating seed. New cells are formed at the tip of the primary root as it extends downward into the soil forming a “thimble-shaped” cluster of cells called a root cap (Figure 1).
The root cap serves as a type of shield that helps the root penetrate the soil matrix and protect the developing root tissue. As the root grows downward into the soil the root cap cells are sloughed off creating a slimy surface that helps lubricate the root as it extends deeper into the soil.
The growing point (apical meristem) for the developing root is just behind the root cap and this is the zone of new cell formation that facilitates root growth and replaces the cells that are sloughed off as the root grows through the soil. The new cells elongate and serve to extend the roots into the soil (Figure 1).
The most active parts of the plant root system for mineral nutrient and water uptake are in the tiny root hairs that are formed in zone behind the apical meristem. Root hairs are only formed in the relatively new and freshly developed root tissue. The root hairs are extremely small, tender, and physiologically active. Healthy fresh young roots and root hairs should be clean and white.
Root hairs are often referred to as “feeder roots” due to their high-level of activity in securing water and nutrients from the soil for the growing plant. In the process of transplanting, it is important to protect the feeder roots as much as possible and promote their health to ensure rapid adaptation to the new soil environment.
Young plants have the capacity to develop basic aboveground tissue to perform sufficient photosynthesis for establishment and growth due to the plant’s ability to take up mineral nutrients and water from the soil from the root system. Sometimes it can appear that plants are not growing rapidly while the young crop is investing energy and resources into root system development, which is the foundation for the subsequent plant growth and development.
The depth of the roots will vary according to the soil physical conditions and effective soil depth, soil fertility and salinity management, plant-available water, and of course the natural rooting characteristics of the plant.
In general, there are two basic types of plant root systems. Broadleaf plants (dicotyledonous) and coniferous plants (gymnosperms) commonly have a taproot system the extends downward through the soil developing root branches from the primary root stem (Figure 2).
Grass plants and their relatives (monocotyledonous plants) produce fibrous root systems that branch extensively and radiate out into the soil from the plant base (Figure 2).
In general, taproots tend to be deeper with extensive branching from the primary root, develop woody tissue on older roots, and are generally long-lived. In contrast, fibrous roots tend to be smaller, short-lived, with less branching.
As roots age, they become more fully developed in conducting nutrients and water to the growing points of the plant, both above and belowground. In all cases, the young and freshly developed root hairs (feeder roots) are the primary zone of water and mineral nutrient uptake.
As root systems age, the older roots will die, and new root tissue is formed. As dead roots are sloughed off, the discarded tissue is attacked by naturally occurring, beneficial soil organisms (bacteria, fungi, protozoa, and worms) the release mineral nutrients and produce soil organic matter. Turnover of root tissue is an extremely important aspect of plant contributions to soil carbon (C), organic matter, and general soil health.
We do not see the plant root systems and we cannot watch root hair development. But it is good to be conscious of root system development since all mineral nutrient, water uptake, and structural support is provided through the roots.
It is necessary to sacrifice a few plants occasionally and evaluate root system health and development. Accordingly, it is good to review and understand normal root structure and function as we work to manage crop plants for optimum growth, development, and yield.

Figure 1. Basic root tip anatomy.

Figure 2. Examples of taproot and fibrous root systems.
At events and in the halls of the Yuma Agricultural Center, I’ve been hearing murmurings predicting a wet winter this year…
As the Yuma Sun reported last week, “The storms of Monday, Aug. 25 [2025], were the severest conditions of monsoon season so far this year in Yuma County, bringing record-rainfall, widespread power outages and--in the fields--disruptions in planting schedules.”
While the Climate Prediction Center of the National Weather Service maintains its prediction of below average rainfall this fall and winter as a whole, the NWS is saying this week will bring several chances of scattered storms.
These unusually wet conditions at germination can favor seedling disease development. Please be on the lookout for seedling disease in all crops as we begin the fall planting season. Most often the many fungal and oomycete pathogens that cause seedling disease strike before or soon after seedlings emerge, causing what we call damping-off. These common soilborne diseases can quickly kill germinating seeds and young plants and leave stands looking patchy or empty. Early symptoms include poor germination, water-soaked or severely discolored lesions near the soil line, and sudden seedling collapse followed by desiccation.
It is important to note that oomycete and fungal pathogens typically cannot be controlled by the same fungicidal mode of action. That is why an accurate diagnosis is critical before considering treatments with fungicides. If you suspect you have seedling diseases in your field, please submit samples to the Yuma Plant Health Clinic or schedule a field visit with me.
National Weather Service Climate Prediction Center: https://www.cpc.ncep.noaa.gov/
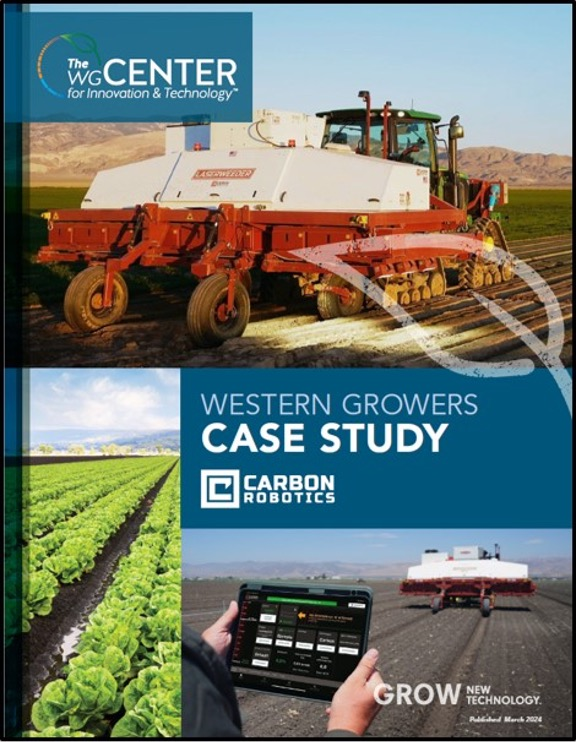
National Weather Service forecast: https://forecast.weather.govNew automated/robotic ag technologies are coming out all the time. Ever wonder how they function in the “real world” and whether they are cost effective? Western Growers recently released a case study report on the economic impact of Carbon Robotics LaserWeeder on overall weeding costs. The study tracked expenses, productivity, and labor savings of the machine operating over one year on several thousand acres at two commercial farms, Braga Fresh and Triangle Farms. It is a well done, detailed study enriched by insightful comments and practical recommendations made by the farm managers responsible for machine operations. It’s an easy read and well worth the time for those interested in the economic and overall feasibility of laser weeding. Check it out hereby clicking the image below. I don’t want to be a spoiler, but I was surprised to learn that despite the initial high cost of the laser weeder ($1.2 million), overall weeding costs at both farms were reduced by about 40% (>$250/acre) in high-density organic crops such as spring mix and spinach.
Stay tuned. Western Growers plans to release five more automation technology case study reports within the next year. Upcoming reports include grower case studies experiences with automated weeding machines from Stout Industrial Technology, Inc. and Ecorobotix; and with autonomous ag platforms from Burro, GUSS Automation, and Bluewhite.

Fig. 1. Western Growers case study report on the economic impact of Carbon
Robotics laser weeding machine on weeding costs at two commercial leafy
green vegetable farms. Click here or on the figure to view. (Photo credit: The
Western Growers Center for Innovation & Technology)
Before making decisions for weed control it’s imperative to have a proper identification of the plant species. There are two names for plants:
The common name, which is a name that people come up with in a certain region to describe a particular weed and it varies by region and therefore can be confusing. Then we have an exact scientific name for each species that is based in the binomial nomenclature system started by Carl Linnaeus in 1753. This binomial (or two term) system includes the genus and the species, which is used worldwide1.
Some very close species from the same family can be controlled by the same product but occasionally their herbicidal susceptibility varies. Such is the case of Chenopodium murale (goosefoot) and Chenopodium album (lambsquarter) two very close and similar species. A product like Pursuit (Imazethapyr) has good activity on goosefoot but can’t control lambsquarters. With accurate identification in a mixed population, you would be able to determine what strategy to use or select the herbicide that would control both species.
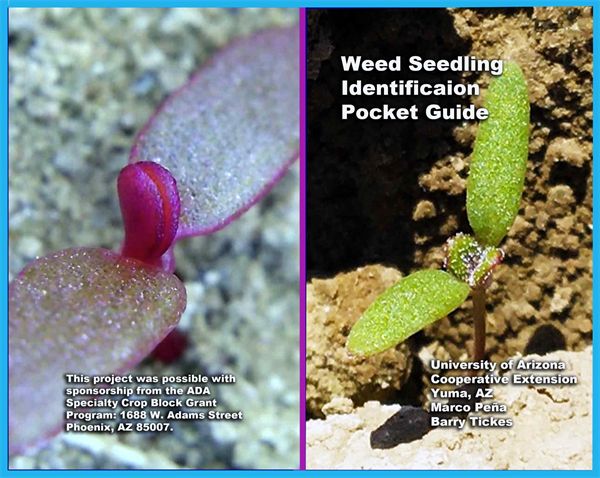
There are about 75 weeds most common in Arizona and are included in the PCA2 study guide, but many other species could be introduced to the State and complicate our crop production systems. Two great tools for weed identification are the books “An Illustrated Guide to Arizona Weeds” that lists 172 species, and “Weeds of California and Other Western States” which has at least one photograph of 735 weeds.
Another weed identification tool is the book “Weeds of the West”.
Additionally, there are many phone applications that can be used as identification tools such as “id weeds”, “PlantNet”, “PictureThis”, “iNaturalist”, “Seek”, “PlantSnap” and “LeafSnap”. When we have problems with weed ID we contact the UA herbarium.
Thank you for sending samples for Weed ID to the IPM Team it is always a learning experience.

Results of pheromone and sticky trap catches can be viewed here.
Corn earworm: CEW moth counts down in most over the last month, but increased activity in Wellton and Tacna in the past week; above average for this time of season.
Beet armyworm: Moth trap counts increased in most areas, above average for this time of the year.
Cabbage looper: Moths remain in all traps in the past 2 weeks, and average for this time of the season.
Diamondback moth: Adults decreased to all locations but still remain active in Wellton and the N. Yuma Valley. Overall, below average for January.
Whitefly: Adult movement remains low in all areas, consistent with previous years.
Thrips: Thrips adults movement decreased in past 2 weeks, overall activity below average for January.
Aphids: Winged aphids are still actively moving, but lower in most areas. About average for January.
Leafminers: Adult activity down in most locations, below average for this time of season.