
In the arid and semi-arid regions of the western U.S. soils were commonly saline from the accumulation of soluble salts due to low rainfall and high evaporation demand from the climate. Most of the soils suitable for crop production agriculture, such as in Arizona, are alluvial soils (deposited over time by water associated with rivers and streams) that are young geologically and very fertile and productive once they are reclaimed from salinity and sodicity. Salts had accumulated in these soils due to water being drawn out of the soils through evaporation. This repeated action over long periods of time resulted in high concentrations of soluble salts deposited in the upper portions of the soil profile. Soils were classified in terms of the salinity levels and today we commonly use the electrical conductivity (EC) of the soil solution as a standard measure. That is because solutions increase in electrical conductivity as the solute concentration, or salinity increases. The measure of EC is used for water (ECw) and the soil solution or soil saturation extracts (ECe).
The international (SI) unit of conductivity is ‘Siemens’ with the symbol ‘S’ per meter. The equivalent non-SI unit is ‘mho’ and 1 mho = 1 Siemens. Thus, for those not familiar with the SI system, mmhos/cm can be read the same as dS/m without any numerical change. The use of mmhos/cm is still found with some laboratories and references.
By definition a saline soil is a non-sodic soil containing sufficient soluble salt to adversely affect the growth of most crop plants with a lower limit of electrical conductivity of the saturated extract (ECe ) being 4 deciSiemens / meter (dS/m) or greater, which is equivalent to a value of 4 mmhos/cm . It is important to note that this is a lower limit by definition but the degree of soil salinity conditions are fully dependent upon the crop in question. Crop plant sensitivity to salinity varies tremendously among species (Tables 1 and 2).
|
Soil Salinity Class |
Conductivity of the Soil Saturation Extract ECe(dS/m) |
General Effect on Crop Plants |
|
Non-saline |
0-2 |
Salinity effects negligible |
|
Slightly saline |
2-4 |
Yields of sensitive crops may be restricted |
|
Moderately saline |
4-8 |
Yields of many crops are restricted |
|
Strongly saline |
8-16 |
Only tolerant crops yield satisfactorily |
|
Very strongly saline |
>16 |
Only a few tolerant crops yield satisfactorily |
Table 1. Soil salinity classes and crop growth.
|
Crop |
0% |
10% |
25% |
50% |
|
Lettuce (Latuca sativaL.) |
1.3 |
2 |
3 |
5 |
|
Potato (Solanum tuberosumL.) |
1.7 |
2.5 |
3.8 |
5.9 |
|
Broccoli (Brassica oleraceaL.) |
2.8 |
4 |
6 |
8 |
|
Cotton (Gossypium hirsutumL.) |
7.7 |
10 |
12 |
16 |
|
Barley (Hordeum vulgareL.) |
8.0 |
12 |
16 |
18 |
Adapted from L. Bernstein, Salt Tolerance of Plants, USDA Bull. 283, 1964 and E.V. Maas, 1984.
Table 2. Salinity tolerance for selected crops with soil solution salinity levels (ECe, dS/m at 25oC) where yields will be reduced by 10, 25, and 50%.
Irrigation Water Quality for Agriculture
Arid land soils are commonly naturally saline due to the process of soluble salt accumulations over long periods of time. Also, the rivers, streams, and aquifers used for irrigation also commonly carry significant concentrations of soluble salts. Dr. Wilford Gardner, one of my predecessors and colleagues from the UA, stated that “Successful irrigation schemes in arid regions carry the seeds of their own demise”. This refers to the natural salinity of irrigation waters that will result in damaging salt accumulations over time if not managed properly.
Irrigation waters in Arizona commonly carry significant salt loads. As an example, by use of a simple conversion factor of 2.7 we can convert the concentration of any given solute in water to pounds (lbs.) of that solute delivered in each acre-foot (AF) of water. The following example uses water with a total solute (salt) concentration of 750 parts per million (ppm or mg/l), which is similar to Colorado River water quality. We can see that delivering five AF of this irrigation water in a single season delivers five tons of salt into that field. As a result, we must deal with this constant salt delivery in desert crop production systems.
Example: Solute Concentration (ppm) X 2.7 = lbs. of solute/AF-water
750 ppm X 2.7 = 2,032.5 lbs. salt/AF
2,032 lbs. salt/AF X 5 AF-water = 10,162.5 lbs. salt/acre
= (5.0 T salt/acre)
Soils consist of sand, silt, and clay particles in various proportions that constitute various soil textures (Figure 1). Clay particles (< 0.002 mm in diameter) are the smallest soil particles and colloidal and these particles generally have a negative net electrical surface charge. The negative charges on the surface of soil particles produce a repulsive force that naturally pushes the particles apart.
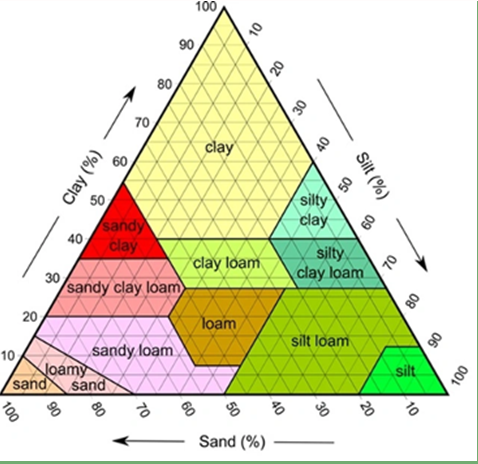
Figure 1. Soil textural triangle.
In soil systems, the soil pores contain water that surrounds the soil particles and the soil solution contains various ions of both positive (cations) and negative (anions) charges in hydrated forms.
The hydrated soil particles and hydrated ions in soil solution interact and cations are naturally attracted to the surface of the soil particles, particularly the clay fraction, and this serves to dissipate the repulsive forces among soil particles and draws them together in aggregate structures. The size of the hydrated layers of the ions in solution can vary depending on the charge density of the ion. Ions of higher charge densities have stronger attractions to water molecules and take on a larger or thicker hydrated layer. Thicker hydrated layers of cations results in weaker forces of attraction of the ion to negatively charged soil surfaces.
Ions in soil solution have varying electrical charge densities and hydrated layers. More highly charged cations, such as calcium (Ca2+) and magnesium (Mg2+) are more favorable to soil particle flocculation and aggregation. Monovalent cations such as sodium (Na+) and potassium (K+) have higher charge densities and attract hydrated layers and as a result they tend to discourage soil flocculation and enhance soil particle dispersion, which can result in greater degrees of soil crusting and reduced water infiltration.
The Exchangeable Sodium Percentage (ESP) is a measure of the amount of exchangeable sodium relative to all exchangeable cations (expressed as the Cation Exchange Capacity, CEC) with cation concentrations in units of electrical charge (cmolc/kg) (Equation 1).
Equation 1. Exchangeable Sodium Percentage (ESP):

Since the CEC determinations in the laboratory are rather time-consuming and challenging, and as a result the Sodium Adsorption Ration (SAR) was developed (Richards, 1954). The SAR is based on chemical equilibrium principles and the interactions between the CEC and soil solution ions and serves as a proxy estimate of the ESP (Equations 2 and 3).
Equation 2. Sodium Adsorption Ratio, SAR (mmol/L):

If the cation measurements are expressed in milliequivalents per liter (meq/L), then the SAR is defined as:
Equation 3. Sodium Adsorption Ratio (meq/L):

Soil aggregation is a favorable physical characteristic, and it facilitates gas and water movement and also root penetration in the soil environment. Aggregation is also important for internal drainage of water through the soil profile, which is important for leaching of solutes and excess soil salinity.
Increased soil ESP or SAR is associated with weakened soil aggregates and an increased likelihood of soil dispersion. However, as previously mentioned, soil aggregate stability is also impacted by total soil salt concentration. High salt levels favor aggregation, whereas low salt concentrations favor dispersion. Good soil particle aggregation facilitates the ability of water to infiltrate into the soil at the surface and pass through the soil profile with good internal drainage. The specific relationship between the ESP and/or SAR and aggregation/dispersion can vary in relation to soil texture and clay mineralogy. Therefore, guidelines for soil management with sodic conditions can also vary in relation to interpretation of ESP and/or SAR results from laboratory analyses.
Irrigation Water Quality and Soil Conditions Relationships
Salinity assessments, commonly measured by the electrical conductivity of the water (ECw, dS/m) and/or total dissolved solids (TDS, mg/L) provide commonly used indexes for evaluating the salinity hazard of the irrigation water. Assessments of the infiltration and the general soil physical conditions regarding soil aggregation or dispersion problems can only be adequately addressed when the salinity and the Exchangeable Sodium Percentage (ESP) or the Sodium Adsorption Ratio (SAR) indexes are considered together. Thus, to properly assess the suitability of a particular irrigation water supply, the salinity of the irrigation water, commonly measured by the ECw, must also be taken into consideration (Table 2). The general parameters described in Table 3 are commonly used to evaluate irrigation waters for agriculture in the western U.S. and other arid and semi-arid regions around the world (Ayers and Westcott, 1989 (1994); Bauer et al. 2014; Fipps, 2003; and Grattan, 2002.)
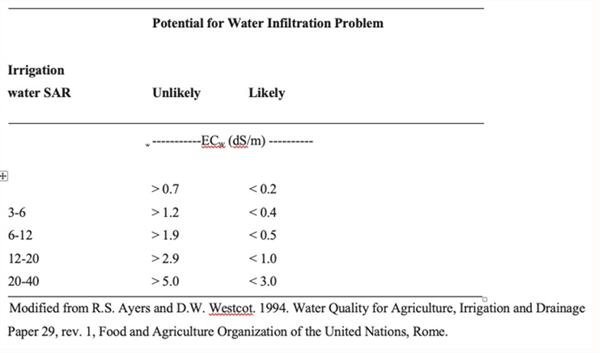
Table 3. Guidelines for interpretation of water quality for irrigation based on SAR and EC.
Agricultural Field Diagnostics
The impacts of irrigation water quality in an agricultural production system are usually expressed first in soil conditions and ultimately in crop response. The chemical analysis of a water source for irrigation and resultant soil conditions provide important tools for evaluating crop production capacities. It is important to use data and analytical information to inform our decisions regarding field level management. Yet it is also critical to make good observations in the field on a regular basis regarding soil and crop conditions.
Due to the high degree of variability associated with natural systems (soil and water) and crop production capacities, management guidelines for using and applying important parameters must take into account the natural variability inherent in these systems. Therefore, guidelines for water quality and soil conditions suitable for agriculture are not set as absolute values but offered as ranges for the purpose of evaluation and diagnosis (Table 3). Laboratory analyses serve as a general set of tools for field and crop diagnosis.
Field diagnostics are somewhat analogous to a clinical analysis in medicine. The laboratory results can serve as important indicators, but the final analysis must include a careful and professional evaluation of the “patient”, which in this case are the soils and crop plants in the field. Therefore, the use of a science-based approach in the evaluation of an agricultural field case is important but appropriate diagnostics in the field also require a specialized skill set that good farmers and agronomists develop and exercise on a regular basis.
Salinity Diagnostics
In the case of increasing soil salinity, the field symptoms should include a well-aggregated soil with good water infiltration and internal drainage. The danger associated with increasing soil salinity is due to plant sensitivity and plants do vary in terms of salinity tolerance as a function of species (Tables 1 and 2) and stage of growth, with plants being most sensitive to salt stress at the germination and seedling development stages of growth. Increasing salt concentrations in soil solution create a higher osmotic potential and as a result it is increasingly difficult for plants to take up water from the soil solution with their root systems as salt concentrations increase. Thus, the symptoms expressed by crop plants in the field are basically the same as plant water stress.
Farmers and agronomists often recognize the effects of increasing soil salinity in relation to increased water stress symptoms by the crop and an apparent need to irrigate to alleviate water stress when seemingly adequate levels of plant-available water exist in the field soil. These changes are most often subtle and increase over time. That is commonly the first set of abnormal conditions that farmers and agronomists first see in the field that can lead to a diagnosis of increasing soil salinity.
Sodium Diagnostics
As previously described, the hydrated Na+ ion in soil solution attracted rather weakly to the negatively charged soil colloid surface but when it is adsorbed to colloid surface in high concentrations the Na+ can diminish the interactive attraction of soil particle aggregation, resulting in soil particle dispersion. Thus, is a chemical feature of the soil-water environment that can create a physical problem (dispersion) in the soil. The standard critical level of adsorbed Na on the soil cation exchange complex is commonly recognized by soil scientists as 15% exchangeable Na (Exchangeable Sodium Percentage, ESP).
However, an ESP of 15% is not an absolute threshold. Soils with higher clay content, and particularly certain types of clays, are more sensitive to soil particle dispersion and problems in the field can be recognized at levels of ESP < 15%.
Farmers and agronomists in the field commonly first recognize possible Na problems with increased soil crusting, reduced water infiltration, and reduced soil aeration. It is very common for farmers and agronomists to first recognize increasing soil dispersion and crusting in the early stages of crop seed germination, emergence, and stand establishment. This is due to the difficulty young seedlings encounter when trying to emerge through a soil with a distinct layer of crust at the surface. The result is often realized with spotty stands of newly emerged plants, non-uniform plant populations, and lower plant populations. These types of problems in the field are usually recognized long before any analytical diagnostics reveal a potential Na problem.
Reclamation and Management
Saline Soil Reclamation and Management
For the reclamation and management of soluble salts in a soil profile, leaching and the downward movement of the soluble salts through the crop root zone is the effective procedure needed. Leaching is accomplished by applying additional amounts of irrigation water to a soil profile that is already saturated. Leaching and the removal of soluble salts is effective when the soil-water moves below the root zone and good internal soil drainage carries the salts out of the soil-plant system in the field. Therefore, movement of water through the soil profile and root zone and good internal soil drainage are essential elements to this process of soil reclamation and management. Soil amendments are not needed for saline soil management. Additional water for salt leaching is needed.
A common question is “how much additional water is needed to accomplish sufficient leaching?”. That is primarily dependent on the crop and the salinity level of the irrigation water. An effective and straightforward method of calculating a leaching requirement (LR) can be calculated with the following equation that was presented by the USDA Salinity Laboratory (Ayers and Westcot, 1989).
Equation 4: Leaching Requirement (LR) Calculation:
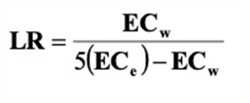
Where:
ECw = salinity of the irrigation water, electrical conductivity (dS/m)
ECe = critical plant salinity tolerance, electrical conductivity (dS/m)
This is a good method of a LR calculation that has been utilized extensively and successfully in Arizona and the desert Southwest for many years. One of the key benefits to this method of LR calculation is the inclusion of the specific crop salinity tolerance. We can easily determine the salinity of our irrigation waters (ECw) and we can find the critical plant salinity tolerance level from commonly available tabulations of salinity tolerance for many crops (Ayers and Westcot, 1989). Additional direct references for crop salinity tolerance levels are from Dr. E.V. Maas’ lab at the University of California (Maas, 1984: Maas, 1986; Maas and Grattan, 1999; Maas and Grieve, 1994; and Maas and Hoffman, 1997).
There are many methods to calculate the proper LR and the one shown here (Ayers and Westcot, 1989) is good in my view because it includes the specific salinity limits for the crop and the salinity levels of the irrigation water. Also, it is very simple and straightforward to use and apply.
For example, we can see in Table 2 from a few selected crops commonly grown in Arizona the variation in salinity tolerance. For a given quality of water (ECe) the LRs calculated from the equation above will increase with lower salinity tolerance levels. For example, lettuce will require a higher LR than cotton or barley using the same water for irrigation.
Sodic Soil Reclamation
The other major issue of reclamation and management of arid region soils is associated with high sodium (Na) concentrations. Sodic soils are often identified by problems with water infiltration and extensive soil crusting. By definition, a sodic soil is non-saline (ECe < 4.0 dS/m) but with relatively high levels of Na on the soil cation exchange complex (CEC). The Na in the soil is commonly measured by the Sodium Adsorption Ratio (SAR) from a soil analysis or the Exchangeable Sodium Percentage (ESP). As pointed out previously, the SAR is commonly used because it is a more direct and faster method of analysis in the laboratory.
|
Classification |
Sodium adsorption ratio (SAR)* |
Electrical conductivity (dS/m) |
Soil pH |
Soil physical condition |
|
Sodic |
>13 |
<4.0 |
>8.5 |
poor |
|
Saline-Sodic |
>13 |
>4.0 |
<8.5 |
varies |
|
Slightly Saline |
<13 |
2 - 4 |
<8.5 |
normal |
|
Saline |
<13 |
>4.0 |
<8.5 |
normal |
|
High pH |
<13 |
<4.0 |
>7.8 |
varies |
1dS/m = mmho/cm
*If reported as exchangeable sodium percentage or ESP, use 15% as threshold value.
Table 4. General classification for sodium hazard of soil based on SAR values.
By definition, sodic soils have an ESP > 15 or an SAR > 13 and a pH > 8.5. However, that is not an absolute diagnostic tool as previously described. Finer textured soils with higher clay content can express sodicity symptoms, soil crusting and infiltration problems, with SAR values of 12 or slightly less. Thus, finer textured soils (higher clay content) are more sensitive in this regard.
Good diagnostics in the field require appropriate field evaluations and an appropriate recognition of sodic soil symptoms. Field observations and evaluations are fundamental aspects of diagnosis and management of sodic soils and best used in conjunction with appropriate soil and water analytical results.
The SAR for a soil can be easily calculated from the laboratory analysis of a good soil sample from the field by use ofEquation 5 shown below.
Equation 5. Sodium Adsorption Ratio = SAR
when using concentrations of mmoles L-1

Sodic soil problems require a two-step process for reclamation that includes first a soil amendment, commonly a calcium (Ca) source to replace the Na on the CEC with materials such as Gypsum (CaSO4). In Arizona and the desert Southwest, our soils are generally very calcareous, with high amounts of natural Ca in the form of CaCO3, commonly known as caliche. Agricultural acid is often used to liberate free Ca in the soil from the caliche present that is then used to effectively exchange for the Na on the soil CEC. Following that chemical exchange, the soluble Na then needs to be leached out of the soil profile, Figure 2. Thus, sodic soil reclamation is a two-step process: 1) Exchange of Na with Ca and 2) leaching of soluble Na+ from the crop root zone.
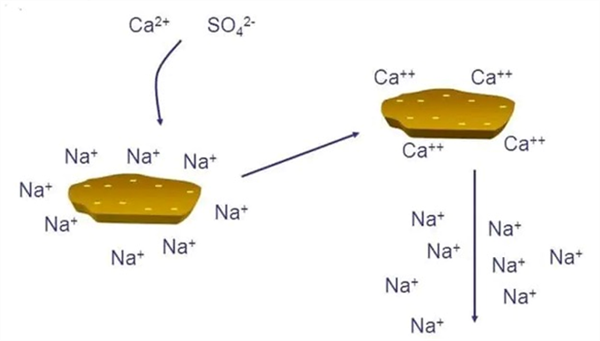
Apply gypsum before leaching salts out of soil (the amount of gypsum is determined by a complete soil analysis
Figure 2. Calcium (Ca2+) and (Na+) exchange and leaching of soluble Na+
Therefore, it is important to note that in either case of dealing with saline and/or sodic soil, leaching and additional water is needed for remediation and sustainable land management. This means additional irrigation water is needed above and beyond the requirement for crop water consumptive use.
Summary
In summary, saline soils need sufficient leaching of soluble salts for reclamation and management. No soil amendments are needed for a saline soil management. Sodic soils will require an amendment to exchange the Na on the soil CEC with Ca or a similar ion. Then soluble Na in soil solution needs to be leached from the crop root zone. Thus, salinity management involves the basic process of adequate soil leaching and sodic soil reclamation is a two-step process: 1) Na exchange and 2) leaching of soluble Na from the crop root zone with sufficient irrigation water.
For viable and sustainable crop production systems in the western U.S., appropriate agronomic (crop and soil) management of soil salinity and sodicity is essential. We need irrigation water to not only sustain crop water needs but also enough water to sufficiently leach the soluble salts from the soil profile. Accordingly, good soil drainage is also essential.
One of the most important and best management practices in the field is to observe and consistently monitor crop and soil conditions, take soil and water samples as part of the routine field monitoring effort, and manage irrigations and drainage systems to accommodate total water needs that our soil-plant systems and crop production operations depend on.
Laboratory analyses are valuable tools when used properly in conjunction with field evaluations and observations. Used together, a proper diagnosis and management strategy for dealing with salinity and sodicity issues in a crop production system can be developed.
References
Ayers, R.S. and D.W. Westcot. 1989 (reprinted 1994). Water quality for agriculture. FAO Irrigation and Drainage Paper 29 Rev. 1. ISBN 92-5-102263-1. Food and Agriculture Organization of the United Nations Rome, 1985 © FAO.
https://www.fao.org/3/t0234e/t0234e00.htm
Bauder, T.A., R.M. Waskom, P.L. Sutherland and J. G. Davis. 2014. Irrigation Water Quality Criteria. Fact Sheet No. 0.506 Crop Series – Irrigation. Colorado State University.
Fipps, G. 2003. Irrigation Water Quality Standards and Salinity Management. Bulletin B-1667.
Texas A&M University AgriLife Extension.
Grattan, S. 2002. Irrigation Water Salinity and Crop Production. Publication 8066, University of California-Davis.
Maas, E.V. 1984. Crop tolerance to salinity. California Agriculture, October 1984. https://calag.ucanr.edu/archive/?type=pdf&article=ca.v038n10p20
Maas, E.V. 1986. Salt tolerance of plants. Appl. Agric. Res., 1, 12-36.
Maas, E.V. and S.R. Grattan. 1999. Crop yields as affected by salinity, Agricultural Drainage, Agronomy Monograph No. 38.
Maas, E. V., and Grattan, S. R. (1999). Crop yields as affected by salinity, agricultural
drainage, Agronomy Monograph No. 38, R. W.
Maas, E. V., and Grieve, C. M. 1994. “Salt tolerance of plants at different growth stages,” in Proc., Int. Conf. Current Developments in Salinity and Drought Tolerance of Plants. January 7–11, 1990, Tando Jam, Pakistan, 181–197.
Maas, E. V., and Hoffman, G. J. (1977). “Crop salt tolerance: Current assessment.”
J. Irrig. Drain. Div. ASCE, 103, 115–134.
I am seeking samples of downy mildew on lettuce from around Yuma County to support the Michelmore Lab and their ongoing efforts to help characterize the downy mildew populations of the United States. The Michelmore Lab has led the charge on a survey of Bremia variants since 1980 and has been instrumental in demystifying the gene-for-gene nature of lettuce resistance to downy mildew.
Their group invites growers across the United States to submit downy mildew infected plant samples, which are then used to culture the Bremia on live host plants. The team then inoculates a panel of lettuce varieties carrying known resistance genes to determine the race of each isolate they receive. Identifying which races occur in which specific fields is essential to guiding the breeding of new resistant cultivars and maximizing the effectiveness of host-based genetic disease management. The data obtained from these tests are also used to designate new Bremia races through the International Bremia Evaluation Board.
Your contribution will help breed better lettuce for Yuma. This means less breakdown of resistance in the field, and better yields for Yuma growers. To facilitate these submissions the Yuma Plant Health Clinic will be setting up a separate drop-off point and submission sheet for downy mildew sample submissions in the same hallway we use for standard plant diagnostic submissions. The drop-off point will be clearly labelled and consist of a chest-style refrigerator and printed copies of the submission form. It is vital to keep these samples cool so they remain viable for future inoculations, so please place your samples inside of the refrigerator before you leave.
Shipping will be handled by the clinic. All we ask is that you fill out the submission form as completely as you can. An example of the questions that are asked in that form so you can prepare ahead of time can be found HERE .Based on last week’s weather, it’s officially summer in my book. Things seem to be slowing down, so I thought I’d change pace this week and take the opportunity to ask you, the readers of this newsletter, if there are any ag automation/mechanization topics you would be interested in hearing more about. I am happy to do some research and share the findings in future articles. Drop me a line at siemens@cals.arizona.edu or feel free to call me at 928.782.5869. I’d love to hear from you.

Fig. 1. Futuristic farming. (Image credits: Emery Reddy, Seattle, WA.)
London Rocket (Sisymbrium irio)
If you drive through the Valley of Yuma Arizona this week you will see a significant amount of London rocket, a winter annual broadleaf weed from the family of the Brassicaceae. We can see it in already harvested lettuce fields, edges of alfalfa fields, on roadsides, orchards, and gardens.
Why London Rocket? According to some sources the common name "London rocket" allegedly comes from its abundance after the Great Fire of London in 1666 even though years later Dr E J Salisbury failed to find specimens in a study in 1940 [1].
The seed leaves (cotyledons) are oval, around 2–6 mm long, without pubescence. True leaves are a bit larger than the cotyledon, has smooth edges or a few weak teeth, and is on a long stalk. Leaves are alternate on the stem.
The mature plant grows approximately 24-36” tall in our area. It grows erect and ranches are mostly close to the base of the plant. The leaves have very little pubescence and have opposite lobes. Right now, we can see its abundant yellow flowers in our area and grow in clusters at the top of the stems (pic below). The fruits are 1-1.5” seedpods that are straight or a little curved and about 1mm wide.
Here in the “Lettuce capital of the world” this weed can be a problem because of it is highly competitive.
In lettuce production the application of Kerb (Pronamide) has shown good London rocket control when applied properly. This means not too early or with too much sprinkler irrigation to avoid leaching. Delayed application is often needed, and the location of the herbicide is critical for best performance. Approximately 1-3 days after starting sprinklers for early plantings (Aug-Sep) and from 3-6 days for mid-season plantings (Oct-Nov) [3].
Interestingly, medical researchers tested some extracts of seeds and found it showed significant antipyretic and analgesic effects and antibacterial action [2]. Other medicinal properties have been reported such as the reduction of swelling and use for cleaning of wounds, rheumatism relief, chest congestion, cough, detoxify the liver and spleen [1].
When weeds like London Rocket are infesting our lettuce or alfalfa fields, they can be such a nuisance. But it's possible that in other parts of the world people are looking for them as beneficial herbs.
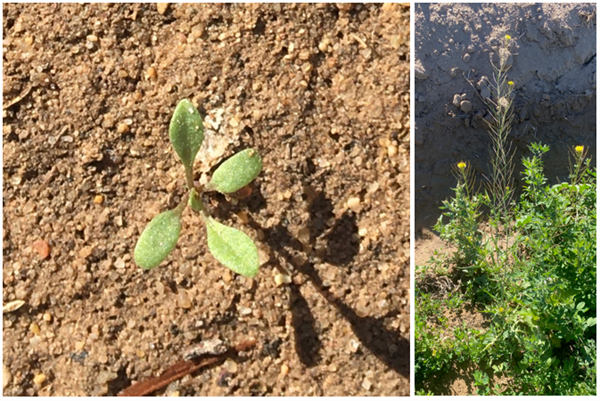
London rocket seedling and mature plant in alfalfa field.
References:
1. Retrieved from: https://en.wikipedia.org/wiki/Sisymbrium_irio
2. Antipyretic, Analgesic and Antimicrobial Studies on Sisymbrium irioS. B. Vohora, S. A. H. Naqvi, I. Kumar (1980) Institute of History of Medicine & Medical Research, Tughlaqabad, New Delhi (India).
3. Retrieved from: https://www.farmprogress.com/timing-critical-kerb-herbicide