In the last of this UA Vegetable IPM Newsletter, I have presented a melon (Cucumis melo ‘reticulatus’ L.) crop phenology model (Figure 1; Silvertooth, 2026) based on heat unit accumulations (86/55 ºF thresholds). This model can be used for predicting and tracking crop development and identifying important stages of crop growth and development (crop phenology).
Referring to the data from AZMET for three locations in the Yuma area, the HU accumulations from 1 January 2025 for a set of four possible 2025 planting dates are listed in Table 1. The HU accumulations from 1 January 2025 to 26 April 2026 for these sites are listed in Table 2.
The HU accumulations after planting (HUAP) for these four possible planting dates for three Yuma area locations to 26 April 2026 are shown in Table 3. The HUAP values in Table 3 are simply the difference between the values in Tables 1 and 2.
An example for the Yuma Valley 15 January 2026 planting date is: 1540 - 95 HU = 1445 HUAP for this case.
The information in Table 3 can help serve as a reference to check for melon crop development in the field against this phenological model in Figure 1. Based on this phenology model and current HU accumulations for this season we should be able to make some projections on the current stage of growth, which we can go to the field and check.
An interesting contrast to the information in Table 3 is that of Table 4 which provides similar information for this time last year, 30 April 2025. This clearly demonstrates the drastic differences in HU accumulations between two sequential seasons and the benefits of using HUbased information as opposed to the calendar for crop development and management.References:
Silvertooth, J.C. 2026. Melon (Cantaloupe) Crop Growth and Development Patterns. University of Arizona Vegetable IPM Newsletter, Volume 17, No.8, 15 April 2026. http://hdl.handle.net/10150/679979

Table 1. Heat unit accumulations (86/55 ºF thresholds) after 1 January 2026 on four possible planting dates utilizing Arizona Meteorological Network (AZMET) data for each representative site.
Yuma Valley: https://azmet.arizona.edu/application-areas/heat-units/station-level-summaries/az02
Yuma North Gila: https://azmet.arizona.edu/application-areas/heat-units/station-level-summaries/az14
Roll: https://azmet.arizona.edu/application-areas/heat-units/station-level-summaries/az24

Table 2. Heat unit accumulations (86/55 ºF thresholds) after 1 January 2026 to 26 April 2026 utilizing Arizona Meteorological Network (AZMET) data for each representative site.
HT = Heat Unit Total Accumulation.

Table 3. Heat unit accumulations (86/55 ºF thresholds) after planting (HUAP) from four possible 2025 planting dates and three sites in the Yuma area on 26 April 2026 utilizing Arizona Meteorological Network (AZMET) data for each representative site. Each value is rounded to the next whole number. Note: the values in Table 3 are determined by taking the difference between the HUs for each representative site and four planting dates in Tables 1 and 2.

Table 4. Heat unit accumulations (86/55 ºF thresholds) after planting (HUAP) from four possible 2025 planting dates and three sites in the Yuma area on 30 April 2025 utilizing Arizona Meteorological Network (AZMET) data for each representative site.

Figure 1. Melon (cantaloupe) phenological development model expressed in Heat Units Accumulated After Planting (HUAP, 86/55 oF).
On April 30th of this year, the U.S. Environmental Protection Agency (EPA) published document EPA-HQ-OPP-2026-2973-0002 entitled the “Draft Fungicide Strategy to Reduce Exposure of Federally Listed Endangered and Threatened Species and Designated Critical Habitats from the Use of Conventional Agricultural Fungicides”. This strategy is officially open for public comment through July 20th, and the Arizona Pest Management Center and the University of Arizona are working on formulating a cohesive response.
This latest draft strategy includes a sizable focus on potential off-site movement of fungicides through runoff associated with treated seed. The following excerpt is taken directly from the document:
“As part of the next steps, EPA is requesting stakeholder input on several aspects of the strategy including… Considerations regarding seed treatments, including seed treatment usage data, information and data on the availability of pesticides on the seed coat to runoff, prevalence of non-commercial (e.g., on-farm, on-site) seed treatments, effects of handling (e.g., loading, planting) on the quality of the pesticide coat and its availability for runoff, and relevant agronomic practices that might reduce the potential for runoff from treated seeds (e.g., seeding depths, disposal)”
Accessible as of June 2026 at https://www.regulations.gov/document/EPA-HQ-OPP-2026-29730002
While the potential route of contaminated off-site runoff from treated seed has been a minor discussion in the scientific literature, it has not been enough of a focus to warrant surveying or regulatory decisions at the federal level thus far. This request for information suggests that this may potentially change going forward. The public comment period presents the best opportunity to bring up practical considerations during early stages before regulatory decisions are made. Regulatory decisions are less likely to present unintended consequences when they are informed by real-world operational perspectives which are ultimately guided by region- and crop-specific experience.
To better inform our response, we are seeking information from across Yuma County to help identify use patterns and current stewardship practices related to fungicide-treated seed. A brief, anonymous, five-minute survey can be found at the following link:
https://uarizona.co1.qualtrics.com/jfe/form/SV_bQpJQzNodI3c5x4
We invite growers, PCAs, seed industry professionals, and distributors to fill it out. If you do not work with treated seed as a grower or PCA, answering the first question will accordingly finish the survey. The response will still provide valuable insight into usage patterns. Thank you in advance for your time and participation.Founded in 2016, FarmWise has been at the forefront of AI based weeding technologies for nearly a decade. Over this time, the company has raised over $65 million in capital. In 2023, the company launched their flagship machine, Vulcan - a 21’ wide automated in-row smart cultivator for vegetable crops, priced at $645,000 (Fig. 1). In a surprising announcement just two weeks ago, FarmWise stated that the company was going through a business restructuring and will cease operations in the coming weeks. The bottom line for the decision was that despite having a field-tested automated weeding machine that reduces hand weeding labor costs, the company has not been able to reach profitability with the resources on hand. Moving forward, the company says that they are actively pursuing strategic opportunities including acquisition, partnerships and technology transfer to ensure the Vulcan technology lives on. During the transition, their number one priority is supporting current customers.
For insightful details on the need for restructuring and FarmWise’s plans going forward, you can refer to articles from The Packer and AgFunderNews.
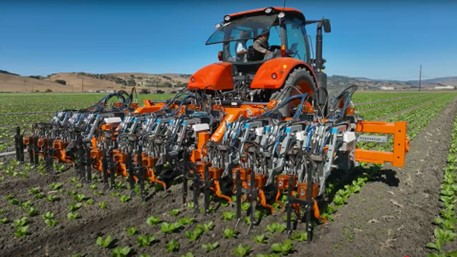
Fig. 1. FarmWise’s automated in-row smart cultivator, the Vulcan, operating in Salinas,
CA. (Photo credit: FarmWise, Santa Clara, CA)
Reference to a product or company is for specific information only and does not endorse or recommend that product or company to the exclusion of others that may be suitable
Identifying weeds at the seedlings stage is one of the biggest challenges in effective weed management. Yet early and accurate weed identification is the foundation of any successful weed control program.
To support this need, I am working on developing a regional Weed Garden at the Yuma Ag Center – a living, curated collection of key agricultural weed species grown under controlled conditions. This space will serve multiple purposes:
By maintaining a contained, year-round population of important desert vegetable weeds, we will be able to improve weed biology education, compare management tools, and support multidisciplinary applied research that reflects real-world production conditions.
In desert vegetable systems, weeds do more than just compete with crops. They often serve as reservoirs for insects and pathogens and as sources of field-level reinfestation, all of which increase production costs and management complexity.
Many priority weeds, such as Amaranthus (Amaranth/Pigweed), Portulaca (Purslane), Malva (Mallow), Solanum (Nightshade), and various Brassicaceae species (Wild Mustard, Shepherd's Purse), lack readily available, hands-on resources for early-season identification or demonstration of management concepts. Currently, there is no consistent local supply of live weed material for extension events, student instruction, or cross-disciplinary IPM demonstrations.
A dedicated Weed Garden would fill this gap by providing a stable, long-term platform for:
Here is an example of this type of project:

Figure 1. Source: Beck, L., & Patton, A. J. (2015). Weed Garden: An Effective Tool
for Extension Education. Journal of Extension, 53(4), Article 15.
https://doi.org/10.34068/joe.53.04.15
Growers and PCAs: Your Input Is Needed
As we begin planning this Weed Garden, I would greatly appreciate your input:
Your feedback will help ensure this Weed Garden becomes a practical, relevant resource for our desert vegetable industry.
Cole crops (broccoli, cauliflower, cabbage, and leafy brassicas) are highly susceptible to green peach aphid and whiteflies. These pests not only reduce plant vigor but can also contaminate harvestable portions and transmit viruses, leading to direct market losses. Azadirachtin-based insecticides (neem-derived products) can be a valuable tool for early-season and rotational use in organic cole crop production.
How do Azadirachtin-Based Insecticides Work?
These effects are particularly important for whitefly management, where targeting immature stages is critical for breaking the life cycle.
Timing for Success
Application Tips for Cole Crops
Cole crops present unique spray challenges due to canopy structure:
Key Limitations
Research-Based Evidence
Field trials conducted in Arizona demonstrate that azadirachtin-based insecticides can suppress populations of green peach aphid and whiteflies on broccoli when applied early and with good coverage.

Figure 1. Green peach aphid numbers on broccoli as affected by azadirachtin-based
insecticides and M-Pede. Treatments with azadirachtin reduced aphid populations
compared to the untreated control. (Yuma, AZ, Spring 2026)

Figure 2. Whitefly numbers on broccoli as affected by azadirachtin-based insecticides.
Treatments with azadirachtin reduced the number of whiteflies compared to the
untreated control. (Yuma, AZ, Fall 2025)
Take-Home Message for Cole Crop GrowersAzadirachtin-based insecticides are a practical option for managing the green peach aphid and whiteflies in organic cole crops. Their effectiveness depends on early application, thorough coverage, and consistent application timing.
Two weeks ago, we discussed how unusually high maximum and minimum air temperatures in Yuma Valley were likely accelerating crop development and shortening the vegetable production window. Mean relative humidity (RH) provides an additional perspective on this spring’s weather pattern because it affects crops through a different pathway than temperature. While temperature strongly influences crop development rate, respiration, and time to maturity, RH is more closely related to atmospheric drying, crop water relations, canopy microclimate, and some aspects of pest management and spray application conditions.
Mean RH at the AZMET Yuma Valley station from January 1 through March 29, 2026, was more variable than the temperature pattern discussed in the earlier blog (Figure 1). Unlike maximum and minimum air temperature, which showed a clearer and more sustained departure from the 2020–2025 pattern, RH fluctuated more over time. Even so, several periods during March 2026 appear to have had relatively lower RH than the recent historical pattern, including part of the late-March period highlighted in the figure. This distinction is important because lower RH under warm conditions can increase the drying power of the air and contribute to greater atmospheric demand for water.

Figure 1. Mean relative humidity at the AZMET Yuma Valley station from January 1
through March 29, 2026, compared with the 2020–2025 pattern.
This RH pattern should be interpreted differently from the maximum and minimum temperature trends. Higher maximum temperatures can accelerate heat-unit accumulation and move crops more quickly toward maturity. Higher minimum temperatures can increase nighttime respiration and reduce carbon-use efficiency by increasing the fraction of assimilated carbon used for maintenance. Lower RH, in contrast, does not directly speed crop development or increase respiration in the same way. Instead, it can increase evaporative demand and strengthen the gradient that drives water loss from the crop and soil surface. When relatively lower RH occurs during an already warm period, crop water demand may increase further, especially in actively growing fields.
From an agronomic standpoint, this means that RH may add to the stress associated with the temperature pattern rather than duplicate it. In fields where irrigation timing, soil moisture, or root-zone conditions are already marginal, periods of lower RH may increase the likelihood of transient midday stress, reduced leaf turgor, and lower growth efficiency. This does not mean that lower RH alone caused crop stress or yield loss, but it may have increased atmospheric pressure on crops that were already developing under unusually warm conditions. For this reason, RH can help explain why water management may have become more challenging during March.
The RH pattern may also have relevance for IPM. Hot and relatively dry conditions can favor some stress-associated arthropod pests in certain crop systems, particularly when the crop is already under heat or water stress. At the same time, relatively drier air may make conditions less favorable for some moisture-dependent foliar diseases. However, these responses are highly dependent on the crop, pest, pathogen, irrigation method, canopy structure, and leaf wetness duration. Therefore, this figure should not be interpreted as showing a universal increase or decrease in pest or disease pressure. Rather, it suggests that the field environment may have shifted in ways that could influence pest dynamics and disease favorability.
Relative humidity may also matter operationally for crop protection. Under hot and relatively dry conditions, spray droplets can evaporate more rapidly, especially during the warmest part of the day. This can make application conditions less forgiving and may increase the importance of timing and coverage. Again, this does not necessarily mean reduced efficacy, but it does mean that lower RH can add practical challenges to foliar application under already warm spring conditions.
Overall, the mean RH does not replace the temperature story described in the blog from two weeks ago. Instead, it adds another layer to it. The earlier temperature data suggested that crops in Yuma Valley may have been developing more rapidly than normal because of unusually warm days and nights. The RH pattern presented here suggests that, during some periods in March, the atmosphere may also have been relatively drier than normal, potentially increasing evaporative demand and adding to crop water-management and IPM complexity. In that sense, this figure helps explain how the spring environment may have become more demanding even beyond temperature alone.
What this may mean going forward
Going forward, this pattern suggests that unusually warm periods combined with lower RH could increase the risk of faster crop development, higher water demand, and more challenging IPM timing in Yuma Valley. If these conditions become more frequent, growers may need to place even greater emphasis on weather-based irrigation scheduling, close field scouting, and timely management decisions.