May 1, 2024
Cantaloupe (Melon) Growth and Development (2024)
Springtime in the desert serves host to a new spring melon/cantaloupe crop. That is particularly true in the lower Colorado River valleys. Cantaloupes (Cucumis melo ‘reticulatus’ L.) or “melons” are one of the important spring and fall vegetable crops of Arizona and the desert Southwest.
Technically, “true” cantaloupes (Cucumis melo ‘cantaloupensis’) are rough, warty fruit, primarily grown in Europe. On a production scale, cantaloupes are not grown commercially in the United States. However, in the United States “cantaloupe” has become a general name of all netted, musk-scented melons (Simonne et al., 1998 and Soto, 2012).
Being able to accurately describe and predict important stages of crop growth and development (crop phenology) and harvest dates is important for improving melon crop management (e.g. fertilization, irrigation, harvest scheduling, pest management activities, labor, and machinery management, etc.). Since plants operate on “thermal time”, they have no regard for calendars or time as we commonly measure it. So, it is best to monitor and predict plant development based on the actual thermal conditions in the plant’s environment.
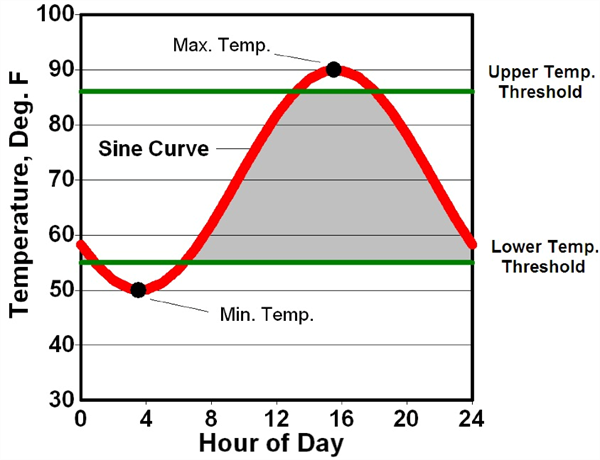
Various forms of temperature measurements and units commonly referred to as heat units (HU), growing degree units (GDU), or growing degree days (GDD) have been utilized in numerous studies to predict phenological events for many crop plants (Baskerville and Emin, 1969; Brown, 1989; Baker and Reddy, 2001; and Soto, 2012). A graphical depiction of HU computation using the single sine curve procedure is presented in Figure 1 (Brown, 1989).
Since 2000, we have been working on the development and annual testing of a phenology model for desert cantaloupe production for Arizona conditions. The basic cantaloupe phenology model is shown in Figure 2 (Silvertooth, 2003; Soto et al., 2006; and Soto, 2012). This melon crop phenology model was developed under fully irrigated conditions.
Guideposts indicated in Figure 2 represent general average or “target” values and a slight degree of variation is normal. It is important to note that water or nitrogen stress are two factors that will significantly alter physiological development of a crop.
Referencing the data from the Arizona Meteorological Network (AZMET) and several locations in the Yuma area, the HU accumulations (86/55 ºF thresholds) from a range of possible 2024 melon planting dates to 28 April are listed in Table 1. These HU accumulations can be referenced against the melon phenology model in Figure 2 and crop conditions in the field.
I encourage those who are working with spring cantaloupe production this season to test and evaluate this crop phenology model in the field under various planting dates, varieties, and conditions. The information in Table 1 can help serve as a reference to check melon crop development in the field against this phenological model. We appreciate your feedback.
References:
Baker, J.T., and V.R. Reddy. 2001. Temperature effects on phenological development and yield of muskmelon. Annals of Botany. 87:605-613.
Baskerville, G.L., and P. Emin. 1969. Rapid estimation of heat accumulation from maximum and minimum temperatures. Ecology 50:514-517.
Brown, P. W. 1989. Heat units. Ariz. Coop. Ext. Bull. 8915. Univ. of Arizona, Tucson, AZ.
Silvertooth, J.C. 2003. Nutrient uptake in irrigated cantaloupes. Annual meeting, ASA-CSSA-SSSA, Denver, CO.
Simonne, A., E. Simonne, R. Boozer, and J. Pitts. 1998. A matter of taste: Consumer preferences studies identify favorite small melon varieties. Highlights of Agricultural Research. 45(2):7-9.
Soto, R. O. 2012. Crop phenology and dry matter accumulation and portioning for irrigated spring cantaloupes in the desert Southwest. Ph.D. Dissertation, Department of Soil, Water and Environmental Science, University of Arizona.
Soto-Ortiz, R., J.C. Silvertooth, and A. Galadima. 2006. Nutrient uptake patterns in irrigated melons (Cucumis melo L.). Annual Meetings, ASA-CSSA-SSSA, Indianapolis, IN.
|
Location
|
15 January
|
1 February
|
15 February
|
1 March
|
|
Yuma Valley
|
994
|
893
|
832
|
680
|
|
Yuma N. Gila
|
972
|
856
|
797
|
650
|
|
Yuma South
|
961
|
862
|
802
|
655
|
Table 1. Heat unit accumulations (86/55 ºF thresholds) from four possible 2024 planting dates utilizing Arizona Meteorological Network (AZMET) data for each representative site.
Yuma Valley:https://ag.arizona.edu/azmet/02.htm
Yuma South: https://ag.arizona.edu/azmet/36.htm
Yuma North Gila: https://ag.arizona.edu/azmet/14.htm

Figure 1. Graphical depiction of heat unit computation using the single sine
curve procedure. A sine curve is fit through the daily maximum and minimum
temperatures to recreate the daily temperature cycle. The upper and lower
temperature thresholds for growth and development are then superimposed
on the figure. Mathematical integration is then used to measure the area
bounded by the sine cure and the two temperature thresholds (grey area).
(Brown, 1989)

Figure 2. Heat Units Accumulated After Planting (HUAP, 86/55 oF)
To contact Jeff Silvertooth go to:
silver@ag.arizona.edu


