We conducted a session at the 2026 SW Ag Summit program on Thursday, 19 February regarding the future of the Colorado River and possible management plans for water allocations that will be very important for agriculture in the lower Colorado River Valley in the next decade. The program outline included the following speakers and components:
All current conservation and operational guidelines expire in 2026. The Department of Interior (DoI) and the Bureau of Reclamation (BoR) set 11 November 2025 as a deadline for basin states (Figure 1) to come forth with an agreement and a new plan for conservation and river management. But the basin states could not come to an agreement, so the DoI extended the deadline to 14 February 2026, and the basin states failed to reach an agreement and meet that deadline.

Figure 1. Map of the Colorado River Basin and watershed. (Source: U.S. Bureau of
Reclamation).
During the SW Ag Summit session prospects for a possible agreement among the Colorado River basin states were discussed. The Lower Basin (LB) states are unified in their efforts to find a common agreement and have offered numerous plans that include substantial conservation reductions on their part, but the Upper Basin (UB) states are unified in their direct opposition to any offers made by the LB and they refuse to make any reductions in their water allocations.
In January 2026, the Bureau of Reclamation BoR published the Draft Environmental Impact Statement (DEIS), which is required in the NEPA process. The DEIS includes five alternative approaches and analyses for consideration in the development of the new operating guidelines.
The five alternative approaches are listed below in very brief terms.
A lot of attention at our SW Ag Summit session was directed at a review and consideration of the five alternatives presented in the DEIS. Figure 2, which describes LB and UB reductions associated with each of the DEIS alternatives plus two others (continued current strategies and supply driven pro-rata), was presented and reviewed. It is important to note the significant reductions from each alternative on the LB allocations while the UB is not subject to any reductions.

Figure 2. Maximum shortages for the Lower and Upper Basins for a series of
possible alternatives. (source: Arizona Reconciliation Committee).
The possible impacts from the DEIS alternatives being considered are both interesting and puzzling considering the contrasting UB and LB facts (Figure 3). Some of the basic facts associated with the economic impact of the use of the Colorado River water include:
The UB states have never utilized their complete allocation of 7.5 MAF of Colorado River water while the LB has consistently utilized their 7.5 MAF and put it to good work (Figure 3). Yet the UB states have been insistent on not making reductions on their part and insisting that all future reductions come the LB.
A huge amount of infrastructure has been developed in the LB in the past 100 years to facilitate the development and productivity described in Figure 3, all in partnership with the United States via the DoI and BoR, Good examples include: the Boulder, Glen Canyon, Parker, Davis, Palo Verde Diversion, and the Imperial Dams as well as the Colorado River Aqueduct and the Central Arizona Project. In review of the DEIS, the proposed alternatives do not seem consistent with the historical precedent established by the DoI and BoR in recognizing the value of the Colorado River in the LB.

Figure 3. Some basic Colorado River basin facts. (Source: Coalition for Protecting
Arizona’s Lifeline, Colorado River Facts.
https://protectingarizonaslifeline.com/members/)
Public input is critical to shape long-term water management for Lake Mead and Lake Powell. Comments have been openly solicited from citizens on the DoI DEIS for Post-2026 Colorado River operations via email to crbpost2026@usbr.gov The deadline was 2 March 2026. However, most of the deadlines imposed by the DoI and BoR for proposals from the basin states have passed without consequence, so perhaps they will extend the period for public comments as well.
The DEIS proposed alternatives can be accessed at the Bureau of Reclamation website. Also, a Web Tool has been developed to help explore and understand different operational strategies: Post-2026 Operations Exploration Web Tool .
Given an opportunity, it is also important to attend meetings hosted by the BoR, which are designed to provide information and collect public input.
First, I want to thank everyone who participated in last week's Vegetable Pest Losses Survey.
This year's survey included the return of the lettuce disease losses section. While several diseases were present and managed last season, downy mildew accounted for the majority of disease management costs by a wide margin. This really underscores the
impact that last spring's unusually rainy weather had on disease development across the Yuma lettuce production region.
No one can predict exactly what this upcoming spring will bring, but there has been discussion about the possibility of a strong El Niño leading to an extended monsoon season. If that proves true, the conditions would once again support spring
downy mildew development. The pathogen only needs about 3 to 4 hours of continuous leaf wetness to infect lettuce, so periods of overnight moisture, prolonged morning dew, or frequent rainfall when inoculum (spores) are present increase disease risk.
With that in mind, this seems like a good opportunity to review what is known about downy mildew and discuss strategies for its management.
Resistance in lettuce to Bremia lactucae, the causal oomycete pathogen behind downy mildew, is inherited in a gene-for-gene fashion, meaning one major gene product in the plant host interacts with one major gene product in the pathogen. When
resistance is present, this leads to an incompatible interaction between plant and pathogen and results in complete immunity to infection. Resistance genes in these types of interactions most often encode a protein molecule that acts like a burglar
alarm. These molecular sensors in the host bind to proteins secreted specifically by the pathogen, and when that happens a storm of defense responses is activated in the plant that excludes further infection. This is not the only mode of genetic resistance
found in plants, but it is often the most drastic and effective against obligate parasites like downy mildew.
But this simple gene-for-gene interaction often puts incredible selection pressure on the pathogen populations to change such that they can get around the resistance. By losing the molecule that the plant detects in order to initiate a defense response,
the pathogen becomes unrecognizable to the resistance genes a plant variety may have. Just like spraying the same mode of action over and over again leads to a pest population developing resistance to a pesticide, the same selection applies to genetic
resistance. The longer a resistance gene is deployed in a region, the more likely the pathogen population is to change in response until that resistance gene is no longer effective at managing the disease.
One of the biggest challenges with lettuce downy mildew is that B. lactucae is constantly changing over time. It exists as many different races, where each race has a different reaction to the resistance genes bred into lettuce varieties. You
can think of these races as different versions of the same pathogen. A lettuce variety that resists one race may still be susceptible to another.
These races are identified by testing them against a panel of lettuce varieties with known resistance genes. In the western United States, races are named by the International Bremia Evaluation Board-U.S. (IBEB-US) and are given names with a number followed by the country’s abbreviation, such as 8US, 9US, or 10US. The populations found in the western U.S. are different from those found in Europe, so each region uses its own independent naming system.
The downy mildew population has changed considerably over time. Earlier races (1US through 4US) are now rarely found in commercial lettuce production. During the 2000s and 2010s, races 5US through 8US became the most common. Race 9US was recognized after being detected repeatedly between 2015 and 2017, and the newest officially recognized race, 10US, was designated in 2025. Below is a pie chart showing the relative frequency of the races identified from 114 Yuma County downy mildew samples between 2023-2024:

Figure 1: Pathotyping results of 114 lettuce samples from Yuma County collected between 2023 and 2024. Data source: https://bremia.ucdavis.edu/bremia_database_main.php
The results show that much of the downy mildew population found in Yuma County is made up of novel strains of Bremia lactucae that have not yet been officially classified as a race. An official race is only recognized after it has been shown to be stable and widespread over multiple locations and growing seasons. These newer strains may disappear over time, or they may eventually become established and earn an official race designation. In the meantime, this means growers and lettuce breeders in Yuma County are often dealing with strains that can dodge the resistance in some lettuce varieties before those strains are common enough to be officially recognized. It also highlights why relying on resistance alone is not enough to manage the disease.
Table 1: Pathotyping and fungicide sensitivity results of samples from Yuma County collected in 2025.

This trend appears to be continuing. All of the downy mildew samples sent for race testing last season were identified as novel strains rather than known, officially designated races.
It's impossible to predict exactly how these new strains will respond to the resistance genes found in today's commercial lettuce varieties. However, because they have not been previously characterized, they are more likely to overcome existing genetic
resistance than the races we already know about.
New strains develop naturally over time. They can arise when different strains exchange genetics (i.e. intermate) or through random mutations. When growers plant varieties with similar resistance packages over large areas, the pathogen population
is placed under strong selection pressure. Any strain that happens to acquire the ability to infect those resistant varieties gains a major advantage and gets to reproduce without competition where other strains cannot. Over just a few disease
cycles, those successful strains can become much more common in the population until they are the predominant strain overall.
An important point to remember is that the resistance bred into commercial lettuce varieties is not wearing out or becoming weaker over time. The genetics in the lettuce remain just as effective as when the variety was released. What changes is the
pathogen. As the downy mildew population evolves new strains emerge that can bypass resistance genes that previously worked very well.
That means that varieties carrying resistance to races 5US through 10US are still doing exactly what they were designed to do. They continue to suppress those known races and help prevent them from becoming widespread in commercial fields. So, if
you experience significant downy mildew in a field planted with a variety that has a strong resistance package, the culprit is most likely one of these newer, uncharacterized strains rather than a failure of the variety itself.
Unfortunately, Bremia lactucae can evolve much faster than scientists can identify new races and breeders can develop and release resistant varieties. That's why no resistance package should be viewed as a stand-alone solution.
This is also why extension, researchers, and the seed and crop protection industries place so much emphasis on the integrated pest management (IPM) concept. Genetic resistance is an essential tool, but it works best and remains the most sustainable when combined with other management practices. For novel strains that can slip past host resistance, timely fungicide applications and other disease management strategies become especially important for maintaining control.

Figure 2: Mean disease severity by treatment. Disease severity was determined by rating 10 plants within each of the five replicate plots per treatment using the following rating system: 0 = no downy mildew present; 1 = downy mildew present on bottom leaves of plant; 2 = downy mildew present on bottom leaves and lower wrapper leaves; 3 = downy mildew present on bottom leaves and all wrapper leaves; 4 = downy mildew present on bottom leaves, wrapper leaves, and cap leaf; 5 = downy mildew present on entire plant. Disease severity is displayed as the mean of five replicates across all three lettuce varieties and bars show a 95% confidence interval around the mean calculated from individual treatment data. Compact letter display (CLD) above boxes show significantly different treatments (Kruskal-Wallis ANOVA and Dunn’s test). Boxes sharing the same letter(s) are not significantly different from one another. Fb = “followed by” in the rotation. Not all products are registered yet for use in lettuce. The inclusion of specific fungicide products or formulations in these trials does not constitute an endorsement or recommendation over other labeled products.
The most effective way to manage lettuce downy mildew is to use an integrated approach. Plant varieties with a strong resistance package against races 5US through 10US, and pair that resistance with timely, full-label-rate fungicide applications when environmental conditions favor disease. This combination provides the broadest and most reliable protection against both known races and the novel strains that continue to emerge in Yuma County.
If you have any concerns regarding the health of your plants/crops please consider submitting samples to the Yuma Plant Health Clinic for diagnostic service or booking a field visit with me:
Christopher Detranaltes, Ph.D.
Cooperative Extension – Yuma County
Email: cdetranaltes@arizona.edu
Cell: 602-689-7328
6425 W 8th St Yuma, Arizona 85364 – Room 109At the 2025 Southwest Ag Summit Field Demo a couple of weeks ago, many of the latest technologies were demonstrated in the field. Most were related to pest control. Several of the technologies demonstrated are new to the Yuma, AZ area. The recent technologies presented included two types of high precision spot sprayers for weeding and applying beneficial pesticides (Fig. 1a, Fig. 1b) and an AI based lettuce thinner. Manufacturers stated the technologies will be getting even better/more versatile soon. Both precision spot sprayer companies are developing models for small lettuce so that the machines can also be used for lettuce thinning. Also new was that the AI lettuce thinner technology is being further developed so that the device can be used also be used as a weeder. Several “older” pest control technologies also seemed to garner a lot of interest. These included an implement designed for cultivating high density crops (Fig. 1d), a camera guided cultivator equipped with in-row weeding tools (Fig. 1e) and a field scale drone sprayer (Fig. 1f).
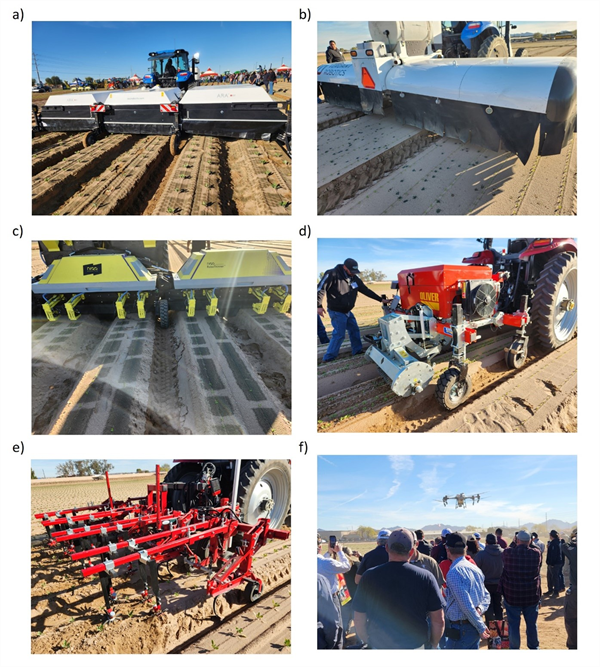
Fig. 1. Newer pest control technologies demonstrated at the 2025 Southwest Ag Summit
Field Demo included a) Ecorobotix1 Ara high precision spot sprayer, b) Verdant Robotics
Sharp Shooter, c) Niqo Robotics AI based lettuce thinner, d) Oliver high density
cultivator, e) Steketee IC Light camera guided cultivator and f) DJI Agras T50 drone
sprayer.
An Economic Reality Check for Small-Scale Arizona Lettuce Producers
As precision robotic weeding and thinning technologies become more accessible, Arizona's small-scale lettuce growers increasingly ask: Does the investment in robotic systems make economic sense for my operation? With labor challenges intensifying across the state and wage pressures mounting, our recently completed trial provides a timely economic analysis specific to Arizona's growing conditions and regional labor markets.
The Economics of Labor vs. Technology in Arizona
Traditional lettuce hand weeding and thinning costs in Arizona:
Precision robotic weeding/thinning system costs:
Key Economic Factors to Consider for Arizona Operations
Farm Size Threshold
In Arizona, robotic systems become economically viable for farms where weeding and thinning labor costs exceed $8,000–$12,000 per season. Small operations (under 20 acres of lettuce) may find rental or shared-equipment arrangements more cost-effective than outright purchase. Service-based models (RaaS) have emerged as a practical entry point, particularly for farms in Yuma County and other Arizona production regions where labor scarcity is acute.
Labor Availability Crisis in Arizona
Arizona's desert lettuce production regions face acute labor constraints. In regions where reliable labor is scarce or increasingly expensive, a reality across Arizona's major growing areas, precision robotic systems provide operational predictability while reducing damage risk. One precision robotic system operating consistently may replace 3–5 seasonal hand workers, improving both economics and quality control. Arizona growers who have struggled with labor availability during critical thinning and weeding windows recognize the operational value of robotic consistency.
Marketable Yield
Arizona's intensive production system and specialized lettuce varieties demand precision crop management. Many Arizona growers report hand labor costs ranging from $161 to $454 per acre, depending on specific field conditions, weed density, and bed width. Even modest yield improvements of 5% from reduced crop damage can offset system costs, particularly when inexperienced hand crews are the alternative. Given Arizona's premium lettuce market positioning, yield quality and consistency provide additional value beyond simple volume.
Operational Flexibility and Regional Equipment Availability
Renting or leasing robotic weeding/thinning systems allows Arizona small farms to avoid large capital expenditures while testing technology fit. Equipment providers now offer season-specific rental arrangements suitable for small-scale Arizona operations. Robotics-as-a-Service (RaaS) models, where growers pay per acre or per hour rather than owning hardware, have emerged as a game-changer for Arizona small operations, with several providers now establishing regional service capabilities in Yuma and surrounding areas.
Financial Decision Framework for Arizona Growers
Consider purchasing/owning robotic weeding/thinning systems if:
Consider service-based (RaaS) or rental/leasing robotic systems if:
Stick with traditional hand operations if:
Return on Investment (ROI) for Arizona Operations
The primary driver for adoption is the economic disparity between robotic costs and manual labor, a gap that has widened significantly in Arizona.
Labor Cost Baseline for Arizona: In Arizona's major growing regions like Yuma, manual hand thinning and weeding costs range from $100 to $454 per acre, with an average of $250–$350 per acre for experienced crews during peak seasons.
Payback Period: Most robotic systems aim for a break-even point within 2–3 years. For Arizona operations relying on expensive seasonal labor or facing acute worker shortages, ROI can sometimes be achieved within a single season, particularly if labor costs exceed $300 per acre.
Secondary Benefits: Beyond labor savings, precision robotic systems can increase yields by approximately 5% through reduced crop damage compared to manual crews and better weed control. For Arizona's premium lettuce market, quality improvements and consistency may provide additional market premiums.
Arizona-Specific Considerations:
Key Takeaway for Arizona Growers
Precision robotic weeding and thinning technology is no longer exclusively for large-scale operations. For Arizona's small-scale lettuce growers facing mounting labor costs, unpredictable seasonal workforce availability, and premium market positioning, the economics increasingly favor at least exploring service-based, rental, or shared-equipment options. Arizona's unique labor market dynamics and growing season characteristics make robotic technology particularly relevant. The decision hinges on your specific operation: farm size, local labor costs, available capital, and risk tolerance for new technology.
Interested in Field Trials?
If you have any questions or are interested in doing a trial, please reach out to weed specialist Mazin Saber at the University of Arizona Yuma County Cooperative Extension. Dr. Saber leads research initiatives comparing manual labor to commercially available robotic weeding technologies to establish sustainable weed control programs for Arizona desert agriculture.
Relative humidity (RH) is a microclimate variable that strongly shapes crop water relations, canopy wetness duration, and the “comfort zone” for many pests and pathogens. In leafy greens, RH influences transpiration rate, stomatal behavior, and leaf-surface wetness, which are tightly linked to crop stress and disease favorability. Using the AZMET Yuma Valley station annual summaries (1987–2025), our figures show that maximum, minimum, and average RH have declined over time, even though year-to-year variability remains evident.
In Figure 1 (maximum RH), the trendline equation is y = −0.099x + 27.1 with R² = 0.11. The negative slope indicates a gradual decline in annual maximum RH at approximately −0.099 percentage points per year (about −0.99% per decade). The yellow dotted line represents the long-term mean for the series, providing a visual reference for how many years fall above or below the multi-decadal baseline.
In Figure 2 (minimum RH), the trendline equation is y = −0.12x + 24.9 with R² = 0.33. This is the strongest RH signal among the three metrics, indicating that annual minimum RH has decreased at roughly −0.12 percentage points per year (about −1.2% per decade). The higher R² value suggests that the drying signal is more consistently expressed in the minimum RH metric, which is often closely tied to the driest parts of the diurnal cycle and evaporative demand.
In Figure 3 (average RH), the trendline is y = −0.13x + 28.2 with R² = 0.21, indicating a decline in annual average RH of about −0.13 percentage points per year (approximately −1.3% per decade). As in the other figures, the yellow dotted line marks the long-term mean, illustrating that recent years more frequently sit at or below the historical baseline.
What this means for leafy greens agronomy
A gradual decline in RH generally implies higher atmospheric demand for water (a drier air mass), which can increase crop transpiration and intensify the need for precise irrigation management. For leafy greens, this can translate into:
What this means for IPM
Declining ambient relative humidity in the AZMET Yuma Valley record suggests the background atmosphere is gradually becoming drier, which typically corresponds to higher evaporative demand. For IPM in leafy greens, this should be interpreted cautiously: many foliar diseases are favored by extended leaf wetness and high canopy humidity, so fewer naturally humid periods may slightly reduce baseline favorability. However, in irrigated systems the conditions that matter most for infection—irrigation method and timing, canopy density, and short-term weather events—can still create localized humid microclimates and wet leaves even when ambient RH is trending downward. Likewise, lower RH combined with warm conditions can increase the likelihood of transient crop water stress if irrigation is not well aligned with demand, which can indirectly affect pest dynamics and tighten scouting and management windows. Overall, the long-term RH decline is best viewed as a shift toward greater atmospheric drying power, while day-to-day IPM risk remains primarily governed by crop stage, irrigation practices, canopy microclimate, and episodic weather rather than the trend alone.

Figure 1. Distribution and long-term trend in annual maximum relative humidity
(RHmax) at the AZMET Yuma Valley station (Yuma Valley, AZ) for 1987–2025; the
dashed line shows the linear trend and the yellow dotted line indicates the long-term
mean.

Figure 2. Distribution and long-term trend in annual minimum relative humidity
(RHmin) at the AZMET Yuma Valley station (Yuma Valley, AZ) for 1987–2025; the
dashed line shows the linear trend and the yellow dotted line indicates the long-term
mean.

Figure 3. Distribution and long-term trend in annual average relative humidity
(RHavg) at the AZMET Yuma Valley station (Yuma Valley, AZ) for 1987–2025; the
dashed line shows the linear trend and the yellow dotted line indicates the long-term
mean.
VegIPM Update Vol. 17, Num. 15
July 22, 2026
Results of trap catches below!!
Whitefly: Adult activity remains steady across locations; above average for this time of the year, especially high numbers seen in North Gila Valley. Historically, whitefly numbers peak in July.
Thrips: Adult thrips activity remained low over the last two weeks. About average for this time of the year. Historically, thrips numbers remain low until Sept-Oct.