In the last issue of this UA Vegetable IPM Newsletter, I presented a melon (Cucumis melo ‘reticulatus’ L.) crop phenology model (Figure1; Silvertooth, 2025). This model can be useful in predicting and tracking crop development and identifying important stages of crop growth and development (crop phenology).
Use of a crop phenology model can be applied to basic crop management (e.g. fertilization, irrigation, harvest scheduling, pest management activities, labor, and machinery management, etc.). For use of the crop phenology model, good local weather data with heat unit information is needed. In Arizona we have an excellent weather system with the Arizona Meteorological Network, AZMET.
Since cantaloupes are a warm season crop, we use the86/55 ºF heat unit (HU) thresholds for phenological tracking. Key stages of growth or “guideposts” indicated in Figure 1represent the average or “target” values that are subject to a slight degree of natural variation, which is normal.
This melon crop phenology model was developed under fully irrigated and well-managed conditions. That is important since non-irrigated fields are more likely to experience water stress, which significantly disrupts crop development patterns.
Referring to the data from AZMET for several locations in the Yuma area, the HU accumulations (86/55 ºF thresholds) from 1 January 2025 to a set of four possible 2025 planting dates are listed in Table 1. The HU accumulations from 1 January2025 to 15 April 2025 for these sites are listed in Table 2.
The HU accumulations after planting (HUAP) for these four possible planting dates for three Yuma area locations to 15 April 2025 are shown in Table 3. The HUAP values in Table 3 are simply the difference between the values in Tables 1 and 2. An example for the Yuma Valley, 15 January 2025planting date is: HU - 73.1 HU = 645.6 ~ 646 HUAP.
The information in Table 3 can help serve as a reference to check for melon crop development in the field against this phenological model in Figure 2. Several cantaloupe/melon types are being in this region including western shipper type melons, Tuscan melons, and Hami melons. In the past, each of these melon types have tracked closely with this phenological model.
For melon crops in the lower Colorado River Valley at this time, we can expect to find fields planted and watered up in mid-January to have crown set melons beginning to develop netting, which may not be as apparent on the Hami melons. These fields could have crown fruit ready for harvesting in about three weeks, based on normal HU accumulation patterns for this time of year. For fields planted and wet dates near the first of March, these fields should be vigorously flowering.
Reference:
Silvertooth, J.C. 2025. Tracking Cantaloupe (Melon) Crop Growth and Development. University of
Arizona Vegetable IPM Newsletter, Volume 16, No.7, 2 April 2025.

Table 1. Heat unit accumulations (86/55 ºF thresholds) after 1 January 2025 on four possible 2025 planting dates utilizing Arizona Meteorological Network (AZMET) data for each representative site.
Yuma Valley: https://azmet.arizona.edu/application-areas/heat-units/station-level-summaries/az02
Yuma North Gila: https://azmet.arizona.edu/application-areas/heat-units/station-level-summaries/az14
Roll: https://azmet.arizona.edu/application-areas/heat-units/station-level-summaries/az24

Table 2. Heat unit accumulations (86/55 ºF thresholds) after 1 January 2025 to 14 April
2025 utilizing Arizona Meteorological Network (AZMET) data for each representative site.

Table 3. Heat unit accumulations (86/55 ºF thresholds) after planting (HUAP) from four
possible 2025 planting dates and three sites in the Yuma area on 15 April 2025 utilizing
Arizona Meteorological Network (AZMET) data for each representative site. Each value
is rounded to the next whole number. Note: the values in Table 3 are determined by
taking the difference between the HUs foreach representative site and four planting
dates in Tables 1 and 2.

Figure 1. Melon (cantaloupe) phenological development model expressed in Heat Units
Accumulated After Planting (HUAP, 86/55°F).
At events and in the halls of the Yuma Agricultural Center, I’ve been hearing murmurings predicting a wet winter this year…
As the Yuma Sun reported last week, “The storms of Monday, Aug. 25 [2025], were the severest conditions of monsoon season so far this year in Yuma County, bringing record-rainfall, widespread power outages and--in the fields--disruptions in planting schedules.”
While the Climate Prediction Center of the National Weather Service maintains its prediction of below average rainfall this fall and winter as a whole, the NWS is saying this week will bring several chances of scattered storms.
These unusually wet conditions at germination can favor seedling disease development. Please be on the lookout for seedling disease in all crops as we begin the fall planting season. Most often the many fungal and oomycete pathogens that cause seedling disease strike before or soon after seedlings emerge, causing what we call damping-off. These common soilborne diseases can quickly kill germinating seeds and young plants and leave stands looking patchy or empty. Early symptoms include poor germination, water-soaked or severely discolored lesions near the soil line, and sudden seedling collapse followed by desiccation.
It is important to note that oomycete and fungal pathogens typically cannot be controlled by the same fungicidal mode of action. That is why an accurate diagnosis is critical before considering treatments with fungicides. If you suspect you have seedling diseases in your field, please submit samples to the Yuma Plant Health Clinic or schedule a field visit with me.
National Weather Service Climate Prediction Center: https://www.cpc.ncep.noaa.gov/
National Weather Service forecast: https://forecast.weather.govNew automated/robotic ag technologies are coming out all the time. Ever wonder how they function in the “real world” and whether they are cost effective? Western Growers recently released a case study report on the economic impact of Stout Industrial Technology, Inc.’s Smart Cultivator on overall weeding costs. The study tracked expenses, productivity, and labor savings of the machine operating over one year on five types of lettuce crops and 2,700 acres at Triangle Farms in Salinas, CA. It is a well done, detailed study with machine costs and labor savings broken down by crop type and acreage. It’s an easy read and worth the time for those interested in the economic and overall feasibility of automated mechanical weeding. Check it out here or by clicking the image below. I don’t want to be a spoiler, but I was surprised to learn that costs for hand weeding lettuce in Salinas, CA were so high - $525/acre (conventional) and $750/acre (organic) and that in these conditions, the return on the $330K investment for the machine was less than one year when used on 2,700 acres.
Stay tuned. Western Growers plans to release four more automation technology case study reports within the next year. Upcoming reports include grower case studies experiences with the automated weeding machine from Ecorobotix; and with autonomous ag platforms from Burro, GUSS Automation, and Bluewhite. Their first report, which examined the economics of Carbon Robotics’ Laser Weeder at the commercial scale, can be found here.

Fig. 1. Western Growers case study report on the economic impact of Stout Industrial
Technology, Inc.’s weeding machine on weeding costs in lettuce on 2,700 acres at
Triangle Farms, Salinas, CA. Click here or on the figure to view. (Photo credit: The
Western Growers Centerfor Innovation & Technology)
As the weather gets cooler, aphids are migrating back to the desert to harm our crops. It is important to revisit some factors that may favor aphid infestations in your crops, specifically lettuce, and take appropriate action against them.
Nitrogen availability is one of the most important factors in the development of insect pest populations. Excessive application of nitrogen fertilizer to crops will likely increase the feeding preference and consumption rate of insect pests such as aphids, resulting in greater survival, growth, and reproduction. In some situations, high nitrogen levels in plant tissue can decrease resistance and increase susceptibility to aphids’ attacks.
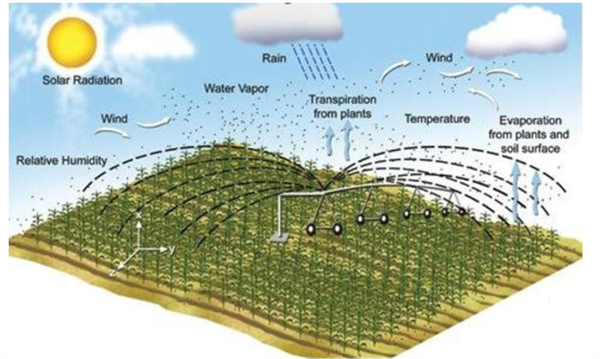
Water management is also very important to consider. Excess water around plant roots can increase nitrogen uptake, which may favor an increase in the aphid population. Thus, supplying proper amounts of nitrogen and water to your crops can tremendously help with aphid management. See this link for more information on this topic.The combination of two separate processes whereby water is lost on the one hand from the soil surface by evaporation and on the other hand from the crop by transpiration, is referred to as evapotranspiration (ET). Evaporation is the process whereby liquid water is converted to water vapor (vaporization) and removed from the evaporating surface (vapor removal). Water evaporates from a variety of surfaces, such as lakes, rivers, pavements, soils, and wet vegetation. Energy is required to change the state of the molecules of water from liquid to vapor. Direct solar radiation and, to a lesser extent, the ambient temperature of the air provide this energy (Fig:1).

Figure 1: Key factors driving ET in agriculture include solar radiation, temperature, wind,
humidity, and plant and soil water loss.
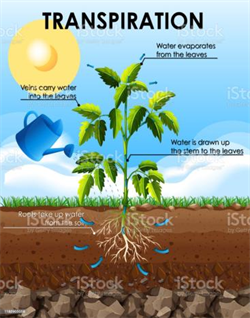
Transpiration consists of the vaporization of liquid water contained in plant tissues and the vapor removal to the atmosphere. Crops predominantly lose their water through stomata. These are small openings on the plant leaf through which gases and water vapor pass. The water, together with some nutrients, is taken up by the roots and transported through the plant (Fig: 2).

Figure 2: A diagram illustrates the process of transpiration in plants, where water is
absorbed by roots, moves through the stem, and evaporates from the leaf surfaces.
Why evapotranspiration (ET)?
ET is the largest component of the hydrological cycle and is one of the most critical variables in irrigation management, crop production, and the sustainability of agriculture. It has a direct impact on water resources availability and use, water quality, and the earth’s energy balance. Daily evapotranspiration (ET) rates are needed for irrigation scheduling. The evapotranspiration rate is normally expressed in millimeters (mm) or inches (in) per unit of time (e.g., an hour, day, week, month, or even an entire growing period or year).
Reducing evapotranspiration (ET) can lead to significant water savings by minimizing unnecessary water loss through soil evaporation and plant transpiration. By applying irrigation more efficiently only when and where it's needed, plants can maintain optimal moisture levels, reducing stress and promoting better growth. This can enhance nutrient uptake, improve plant health, and ultimately lead to higher yields. Moreover, conserving water through reduced ET is especially critical in arid regions, where freshwater resources are limited, and efficient water use is essential for sustainable agricultural production.
Below are strategies to reduce ET

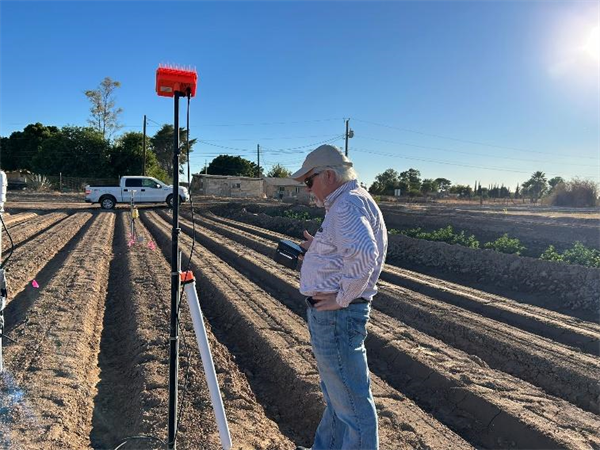
Figure 3: Figure 3. Soil moisture sensor installation at the Valley Research Center,
Yuma, AZ.
Results of pheromone and sticky trap catches can be viewed here.
Corn earworm: CEW moth counts down in most over the last month, but increased activity in Wellton and Tacna in the past week; above average for this time of season.
Beet armyworm: Moth trap counts increased in most areas, above average for this time of the year.
Cabbage looper: Moths remain in all traps in the past 2 weeks, and average for this time of the season.
Diamondback moth: Adults decreased to all locations but still remain active in Wellton and the N. Yuma Valley. Overall, below average for January.
Whitefly: Adult movement remains low in all areas, consistent with previous years.
Thrips: Thrips adults movement decreased in past 2 weeks, overall activity below average for January.
Aphids: Winged aphids are still actively moving, but lower in most areas. About average for January.
Leafminers: Adult activity down in most locations, below average for this time of season.