
Chile (Capsicum annuum) production is an important aspect of vegetable crop production systems in the desert Southwest. The Capsicum annuum species is the most common group of chiles that we encounter and these chiles are common in our southwestern diet. The New Mexico type chile (aka, Anaheim) is a common crop in the desert Southwest including southeastern Arizona, southern New Mexico, west Texas, and northern Chihuahua, Mexico.
There are five domesticated species of chile peppers. 1) Capsicum annuum is probably the most common to us and it includes many common varieties such as bell peppers, wax, cayenne, jalapeños, Thai peppers, chiltepin, and all forms of New Mexico chile. 2) Capsicum frutescens includes malagueta, tabasco, piri piri, and Malawian Kambuzi. 3)Capsicum chinense includes what many consider the hottest peppers such as the naga, habanero, Datil, and Scotch bonnet. 4) Capsicum pubescens includes the South American rocoto peppers. 5) Capsicum baccatum includes the South American aji peppers (Guzman and Bosland, 2017). Some examples are shown in Figure 1 and some other chile pepper species as well.

Figure 1. Capsicum annuum pod types include A) Asian, B) Cayenne, C) Chile de Arbol, D) Chiltepin, E) Hungarian Paprika, F) Jalapeño, G) New Mexican, and H) Poblano. A Capsicum baccatum pod type is I) Aji. Capsicum chinense pod types are J) Bhut Jolokia, K) Habanero, and L) Scorpion. A Capsicum pubescens
pod type is M) Rocoto and a Capsicum frutescens pod type is N)
Tabasco. Source: Guzman and Bosland, 2017.
Crop Phenology
Efficient management of a crop requires an understanding of the basic stages of plant growth in relation to time or age (crop phenology) and basic crop needs. There is a strong phenological relationship with morphological and physiological changes that are taking place and the input requirements important for the crop as the plant develops. As plants change physiologically and morphologically through their various stages of growth, water and nutritional requirements are great examples of crop demand changes that should influence management of the crop in the field.
Heat units (HUs) can be used as a measure of “thermal time” that drives plant development. Thus, HUs can be used as an important management tool for more efficient timing of irrigation and nutrient inputs to crop and pest management strategies. Plants will develop over a range of temperatures which is defined by the lower and upper temperature thresholds for growth (Figures 2 and 3).
Heat unit systems consider the elapsed time that local temperatures fall within the set upper and lower temperature thresholds and thereby provide an estimate of the expected rate of development for the crop. Heat unit systems have largely replaced days after planting in crop phenology models because they consider day-to-day fluctuations in temperature. People still use days after planting to estimate stages of crop development but HUs are more accurate and reliable.
Crop phenology models describe how crop growth and development are impacted by weather and climate and provide an effective way to standardize crop growth and development among different years and across many locations (Baskerville and Emin, 1969; Brown, 1989).
The use of HU-based phenology models is particularly important and applicable in irrigated crop production systems where water is a non-limiting factor. Water stress will alter phenological plant development and it is a major source of variation in crop development models. Accordingly, irrigated systems are more consistent in crop development patterns and HU models can be much more consistent and reliable.
Chiles are a warm season, perennial plant with an indeterminant growth habit that we grow and manage as an annual crop. The fruiting cycle begins at the crown stage of growth and continues until the plant reaches a point of “cut-out” with a hiatus in blooming as the plant works to mature the chile fruit crop that has been developed.
Figure 4 describes the basic phenological baseline for New Mexico – type chile and was developed from field studies conducted in New Mexico and Arizona (Silvertooth et al., 2010 and 2011; Soto et al., 2006; and Soto and Silvertooth, 2007). The use of HUs (86/55 oF thresholds) are applied in this development model since chiles are a warm season plant (Figures 2 and 3).
Heat units accumulated after planting (HUAP) for any date of planting to the present date can be easily accessed in the Arizona Meteorological Network (AZMET) website.
https://azmet.arizona.edu/
Also, the new HUAP tool for cotton that Dr. Jeremy Weiss, AZMET Director, recently developed can be used for chiles or other warm season crops. The same 86/55 oF thresholds are used and the model does not know what crop you are working with. It is a quick and easy way to calculate HUAP totals for any planting date in 2024.
https://viz.datascience.arizona.edu/azmet/cotton-growth-stages-and-heat-units/

Figure 2. Typical relationship between the rate of plant growth and development
and temperature. Growth and development ceases when temperatures decline
below the lower temperature threshold (A) or increase above the upper
temperature threshold (C). Growth and development increases rapidly when
temperatures fall between the lower and upper temperature thresholds (B).

Figure 3. Heat unit calculation with the sine curve method using upper and
lower temperature thresholds (Brown, 1989). The 86/55 ºF thresholds are used,
consistent with most warm season crops.

Figure 4. Basic phenological guideline for irrigated New Mexico-type chiles.
References
Baskerville, G.L. and P. Emin. 1969. Rapid estimation of heat accumulation from maximum and minimum temperatures. Ecology 50:514-517.
Bosland, P.W., E.J. Votava, and E.M. Votava. 2012. Peppers: Vegetable and spice capsicums. Wallingford, U.K.: CAB Intl.
Brown, P. W. 1989. Heat units. Bull. 8915, Univ. of Arizona Cooperative Extension, College of Ag., Tucson, AZ.
Guzmán, I. and P.W. Bosland. 2017. Sensory properties of chile pepper heat - and its importance to food quality and cultural preference. Appetite, 2017 Oct 1;117:186-190. doi: 10.1016/j.appet.2017.06.026.
Silvertooth, J.C., P.W. Brown, and S. Walker. 2010. Crop Growth and Development for Irrigated Chile (Capsicum annuum). University of Arizona Cooperative Extension Bulletin No. AZ 1529
Silvertooth, J.C., P.W. Brown and S.Walker. 2011. Crop Growth and Development for Irrigated Chile (Capsicum annuum). New Mexico Chile Association, Report 32. New Mexico State University, College of Agriculture, Consumer and Environmental Science.
Soto-Ortiz, Roberto, J.C. Silvertooth, and A. Galadima. 2006. Crop Phenology for Irrigated Chiles (Capsicum annuum L.) in Arizona and New Mexico. Vegetable Report, College of Agriculture and Life Sciences Report Series P-144, November, University of Arizona.
Soto-Ortiz, R. and J.C. Silvertooth. 2007. A Crop Phenology Model for Irrigated New Mexico Chile (Capsicum annuum L.) The 2007 Vegetable Report. Jan 08:104-122.
Frost and freeze damage affect countless fruit and vegetable growers leading to yield losses and occasionally the loss of the entire crop. Frost damage occurs when the temperature briefly dips below freezing (32°F).With a frost, the water within plant tissue may or may not actually freeze, depending on other conditions. A frost becomes a freeze event when ice forms within and between the cell walls of plant tissue. When this occurs, water expands and can burst cell walls. Symptoms of frost damage on vegetables include brown or blackening of plant tissues, dropping of leaves and flowers, translucent limp leaves, and cracking of the fruit. Symptoms are usually vegetable specific and vary depending on the hardiness of the crop and lowest temperature reached. A lot of times frost injury is followed by secondary infection by bacteria or opportunist fungi confusing with plant disease.
Most susceptible to frost and freezing injury: Asparagus, snap beans, Cucumbers, eggplant, lemons, lettuce, limes, okra, peppers, sweet potato
Moderately susceptible to frost and freezing injury: Broccoli, Carrots, Cauliflower, Celery, Grapefruit, Grapes, Oranges, Parsley, Radish, Spinach, Squash
Least susceptible to frost and freezing injury: Brussels sprouts, Cabbage, Dates, Kale, Kohlrabi, Parsnips, Turnips, Beets
More information:
New automated/robotic ag technologies are coming out all the time. Ever wonder how they function in the “real world” and whether they are cost effective? Western Growers recently released a case study report on the economic impact of Carbon Robotics LaserWeeder on overall weeding costs. The study tracked expenses, productivity, and labor savings of the machine operating over one year on several thousand acres at two commercial farms, Braga Fresh and Triangle Farms. It is a well done, detailed study enriched by insightful comments and practical recommendations made by the farm managers responsible for machine operations. It’s an easy read and well worth the time for those interested in the economic and overall feasibility of laser weeding. Check it out hereby clicking the image below. I don’t want to be a spoiler, but I was surprised to learn that despite the initial high cost of the laser weeder ($1.2 million), overall weeding costs at both farms were reduced by about 40% (>$250/acre) in high-density organic crops such as spring mix and spinach.
Stay tuned. Western Growers plans to release five more automation technology case study reports within the next year. Upcoming reports include grower case studies experiences with automated weeding machines from Stout Industrial Technology, Inc. and Ecorobotix; and with autonomous ag platforms from Burro, GUSS Automation, and Bluewhite.
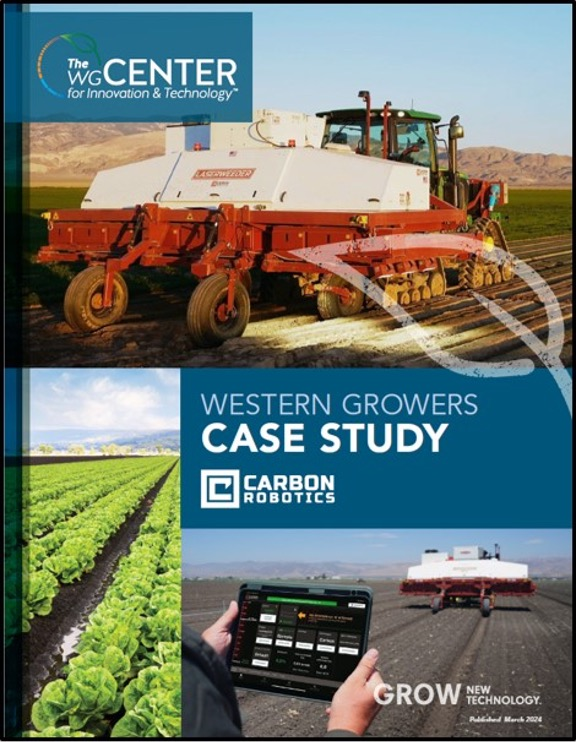
Fig. 1. Western Growers case study report on the economic impact of Carbon
Robotics laser weeding machine on weeding costs at two commercial leafy
green vegetable farms. Click here or on the figure to view. (Photo credit: The
Western Growers Center for Innovation & Technology)
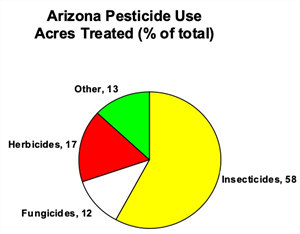
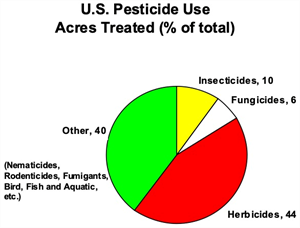
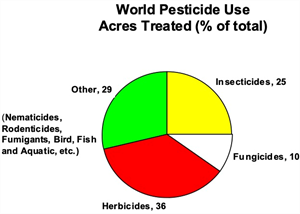
There are many different types of pests that affect crops grown in Arizona. The three types of pests most often cited as the source of most problems are insects, diseases and weeds. These are the same types of pests that are cited as causing the major agricultural pest problems across the U.S. and worldwide. Graphs 1-3 illustrate, however, that the relative importance of these types of pest problems differ in Arizona from the rest of the U.S. and worldwide. In terms of pesticide use, worldwide herbicides accounted for 36% of total usage, insecticides 25%, and fungicides 10% and other 29% (nematicides, rodenticides, fumigants, bird, fish and aquatic pests). In the U.S., herbicides accounted for 44%, insecticides 10%, fungicides 6%, and other 40% of pesticide use. In Arizona, however, insecticides accounted for 58%, herbicides 17% and fungicides 12%. This is only an indirect measure of the relative importance of these three areas of pest management and may be heavily influenced by the amount of pesticides used. For instance, it is common to spray for insects five or more times per season while it is uncommon to spray for weeds more than twice. None the less, these graphs illustrate that weeds are the predominant pest problem in agricultural areas across the U.S. and worldwide.
We wanted to share the information above obtained from the PCA Study Guide Section VI prepared by our "amigo" Barry Tickes who is teaching the Applied Weed Science Class at the University of Arizona this semester.
Results of pheromone and sticky trap catches can be viewed here.
Corn earworm: CEW moth counts remain at low levels in all areas, well below average for this time of year.
Beet armyworm: Trap increased areawide; above average compared to previous years.
Cabbage looper: Cabbage looper counts decreased in all areas; below average for this time of season.
Diamondback moth: DBM moth counts decreased in most areas. About average for this time of the year.
Whitefly: Adult movement beginning at low levels, average for early spring.
Thrips: Thrips adult counts reached their peak for the season. Above average compared with previous years.
Aphids: Aphid movement decreased in all areas; below average for late-March.
Leafminers: Adults remain low in most locations, below average for March.