Springtime in the desert serves host to a new spring melon/cantaloupe crop. That is particularly true in the lower Colorado River valleys. Cantaloupes (Cucumis melo ‘reticulatus’ L.) or “melons” are one of the important spring and fall vegetable crops of Arizona and the desert Southwest.
Technically, “true” cantaloupes (Cucumis melo ‘cantaloupensis’) are rough, warty fruit, primarily grown in Europe. On a production scale, cantaloupes are not grown commercially in the United States. However, in the United States “cantaloupe” has become a general name of all netted, musk-scented melons (Simonne et al., 1998 and Soto, 2012).
Being able to accurately describe and predict important stages of crop growth and development (crop phenology) and harvest dates is important for improving melon crop management (e.g. fertilization, irrigation, harvest scheduling, pest management activities, labor, and machinery management, etc.). Since plants operate on “thermal time”, they have no regard for calendars or time as we commonly measure it. So, it is best to monitor and predict plant development based on the actual thermal conditions in the plant’s environment.
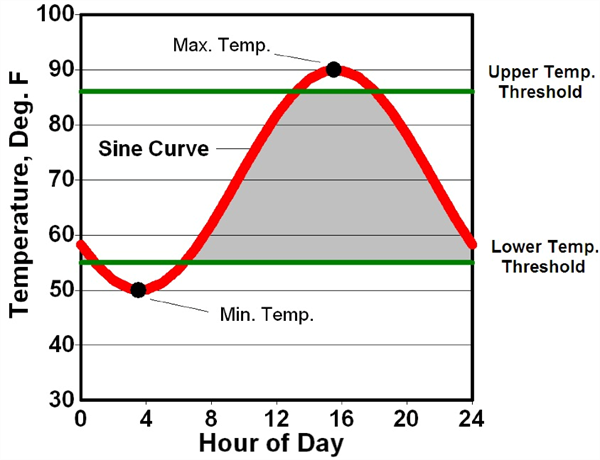
Various forms of temperature measurements and units commonly referred to as heat units (HU), growing degree units (GDU), or growing degree days (GDD) have been utilized in numerous studies to predict phenological events for many crop plants (Baskerville and Emin, 1969; Brown, 1989; Baker and Reddy, 2001; and Soto, 2012). A graphical depiction of HU computation using the single sine curve procedure is presented in Figure 1 (Brown, 1989).
Since 2000, we have been working on the development and annual testing of a phenology model for desert cantaloupe production for Arizona conditions. The basic cantaloupe phenology model is shown in Figure 2 (Silvertooth, 2003; Soto et al., 2006; and Soto, 2012). This melon crop phenology model was developed under fully irrigated conditions.
Guideposts indicated in Figure 2 represent general average or “target” values and a slight degree of variation is normal. It is important to note that water or nitrogen stress are two factors that will significantly alter physiological development of a crop.
Referencing the data from the Arizona Meteorological Network (AZMET) and several locations in the Yuma area, the HU accumulations (86/55 ºF thresholds) from a range of possible 2024 melon planting dates to 28 April are listed in Table 1. These HU accumulations can be referenced against the melon phenology model in Figure 2 and crop conditions in the field.
I encourage those who are working with spring cantaloupe production this season to test and evaluate this crop phenology model in the field under various planting dates, varieties, and conditions. The information in Table 1 can help serve as a reference to check melon crop development in the field against this phenological model. We appreciate your feedback.
References:
Baker, J.T., and V.R. Reddy. 2001. Temperature effects on phenological development and yield of muskmelon. Annals of Botany. 87:605-613.
Baskerville, G.L., and P. Emin. 1969. Rapid estimation of heat accumulation from maximum and minimum temperatures. Ecology 50:514-517.
Brown, P. W. 1989. Heat units. Ariz. Coop. Ext. Bull. 8915. Univ. of Arizona, Tucson, AZ.
Silvertooth, J.C. 2003. Nutrient uptake in irrigated cantaloupes. Annual meeting, ASA-CSSA-SSSA, Denver, CO.
Simonne, A., E. Simonne, R. Boozer, and J. Pitts. 1998. A matter of taste: Consumer preferences studies identify favorite small melon varieties. Highlights of Agricultural Research. 45(2):7-9.
Soto, R. O. 2012. Crop phenology and dry matter accumulation and portioning for irrigated spring cantaloupes in the desert Southwest. Ph.D. Dissertation, Department of Soil, Water and Environmental Science, University of Arizona.
Soto-Ortiz, R., J.C. Silvertooth, and A. Galadima. 2006. Nutrient uptake patterns in irrigated melons (Cucumis melo L.). Annual Meetings, ASA-CSSA-SSSA, Indianapolis, IN.
|
Location |
15 January |
1 February |
15 February |
1 March |
|
Yuma Valley |
994 |
893 |
832 |
680 |
|
Yuma N. Gila |
972 |
856 |
797 |
650 |
|
Yuma South |
961 |
862 |
802 |
655 |
Table 1. Heat unit accumulations (86/55 ºF thresholds) from four possible 2024 planting dates utilizing Arizona Meteorological Network (AZMET) data for each representative site.
Yuma Valley:https://ag.arizona.edu/azmet/02.htm
Yuma South: https://ag.arizona.edu/azmet/36.htm
Yuma North Gila: https://ag.arizona.edu/azmet/14.htm

Figure 1. Graphical depiction of heat unit computation using the single sine
curve procedure. A sine curve is fit through the daily maximum and minimum
temperatures to recreate the daily temperature cycle. The upper and lower
temperature thresholds for growth and development are then superimposed
on the figure. Mathematical integration is then used to measure the area
bounded by the sine cure and the two temperature thresholds (grey area).
(Brown, 1989)

Figure 2. Heat Units Accumulated After Planting (HUAP, 86/55 oF)
Frost and freeze damage affect countless fruit and vegetable growers leading to yield losses and occasionally the loss of the entire crop. Frost damage occurs when the temperature briefly dips below freezing (32°F).With a frost, the water within plant tissue may or may not actually freeze, depending on other conditions. A frost becomes a freeze event when ice forms within and between the cell walls of plant tissue. When this occurs, water expands and can burst cell walls. Symptoms of frost damage on vegetables include brown or blackening of plant tissues, dropping of leaves and flowers, translucent limp leaves, and cracking of the fruit. Symptoms are usually vegetable specific and vary depending on the hardiness of the crop and lowest temperature reached. A lot of times frost injury is followed by secondary infection by bacteria or opportunist fungi confusing with plant disease.
Most susceptible to frost and freezing injury: Asparagus, snap beans, Cucumbers, eggplant, lemons, lettuce, limes, okra, peppers, sweet potato
Moderately susceptible to frost and freezing injury: Broccoli, Carrots, Cauliflower, Celery, Grapefruit, Grapes, Oranges, Parsley, Radish, Spinach, Squash
Least susceptible to frost and freezing injury: Brussels sprouts, Cabbage, Dates, Kale, Kohlrabi, Parsnips, Turnips, Beets
More information:
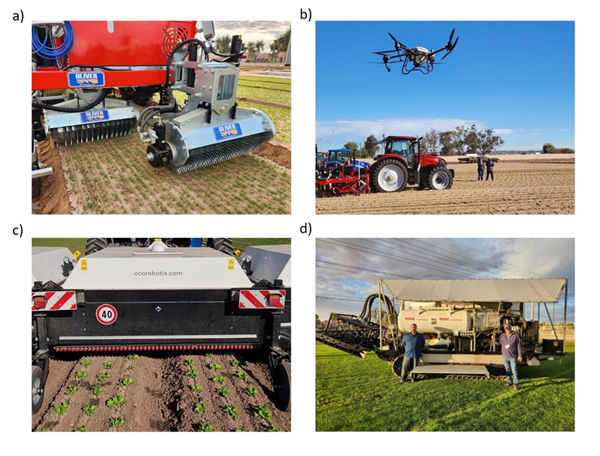
At the 2024 Southwest Ag Summit Field Demo a couple of weeks ago, many of the latest technologies were demonstrated in the field. Most were related to pest control. Several of the technologies demonstrated or on display at the event are brand new to the Yuma, AZ area. The new technologies presented included an implement designed for cultivating high density crops (Fig. 1a), a field scale drone sprayer (10.6 gal) (Fig. 1b), a high precision spot sprayer (Fig. 1c) and a self-propelled machine that disinfests soil prior to planting using steam. Updated versions of laser weeders, camera-guided cultivators and smart, automated in-row weeding machines (mechanical) were also demonstrated. Over the next several years, it will be interesting to watch the technologies in this space evolve further and become integrated into our cropping systems.

Fig. 1. New pest control technologies demonstrated/on display at the 2024
Southwest Ag Summit Field Demo included a) Oliver1 high density cultivator b)
DJI Agrospray T40 drone sprayer c) Ecorobotix ARA high precision spot sprayer
and d) UC Davis/University of Arizona self-propelled steam applicator for
disinfesting soil prior to planting.
[1] Reference to a product or company is for specific information only and does not endorse or recommend that product or company to the exclusion of others that may be suitable.
During this time of the year, we visit fields and constantly receive plant samples with symptoms of what could be herbicide, disease, or insect injury. Our Plant Pathologist Dr. Bindu Poudel-Ward analyzes them for pathogens, Dr. John Palumbo checks for insect damage, and we also examine for possible herbicide injury.
As we all know IPM involves an interdisciplinary effort to identify and prevent problems we encounter in our industry.
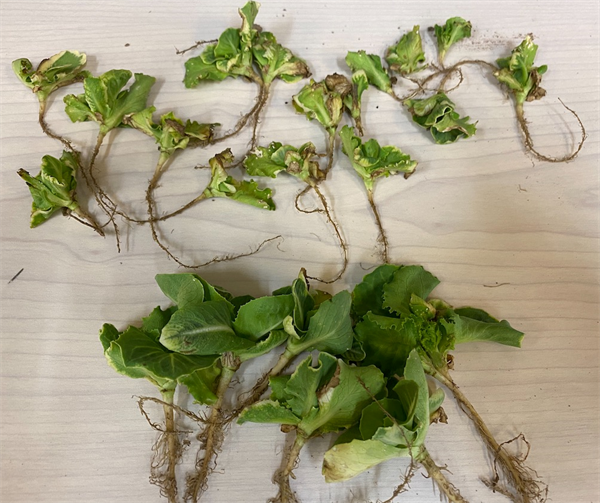
Kerb, Balan, and Prefar are the major herbicides we have used in lettuce production in Arizona for the last 50 years. These herbicides work by inhibiting root growth in small weeds and under some specific conditions can injure lettuce.
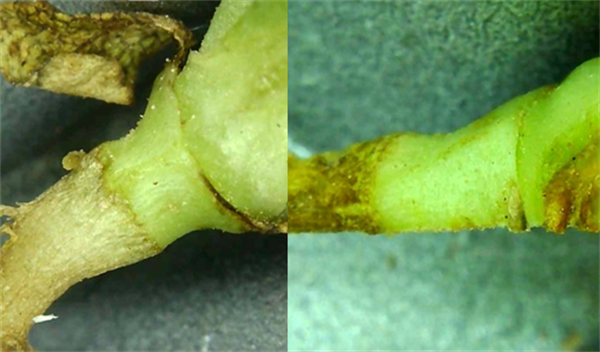
Symptoms of injury could include stunting, leaf margin chlorosis, malformation of the cotyledons and first true leaves, inhibition of main root and lateral roots. Diagnostics sometimes can be challenging because some of the symptoms can also be produced by other factors such as the soil salinity, water management problems, environmental stress or cold, diseases, possible drift from chemical thinning operations and other factors.
It is common that growers send soil or tissue samples to laboratories to compare herbicide concentrations from a healthy section of the field with the affected injured area. If the concentration of the compound in question is significantly different between “healthy” and “bad” samples this could be an indication of herbicide injury. Most laboratories use gas chromatographs (GC) and liquid chromatographs (HPLC) for analysis. Standard extraction and detection methods are costly but accurate and precise3.
The following links will take you to publications that (1) could help you identify some of the symptoms of common lettuce herbicide injury and (2) interpret results reported by laboratories.
References:


Results of pheromone and sticky trap catches can be viewed here.
Corn earworm: CEW moth counts remain at low levels in all areas, well below average for this time of year.
Beet armyworm: Trap increased areawide; above average compared to previous years.
Cabbage looper: Cabbage looper counts decreased in all areas; below average for this time of season.
Diamondback moth: DBM moth counts decreased in most areas. About average for this time of the year.
Whitefly: Adult movement beginning at low levels, average for early spring.
Thrips: Thrips adult counts reached their peak for the season. Above average compared with previous years.
Aphids: Aphid movement decreased in all areas; below average for late-March.
Leafminers: Adults remain low in most locations, below average for March.