
Water and nutrient demands coincide with the fruiting cycle of most crop plants. The efficient management of irrigation water and plant nutrients is enhanced by tracking crop development in the field and making decisions on plant demand and condtion. The use of heat units (HUs) with 86/55 oF upper and lower thresholds can be applied to warm season crops in the desert Southwest in relation to the thermal environmental impacts on the development of all crop systems (Brown, 1989), including chiles, (Figures 1 and 2).
Crop Phenology Relationship to Water and Nitrogen Demand
Phenological guidelines have been developed for many crops, including New Mexico (NM) type chiles (Soto-Ortiz and Silvertooth, 2007 and Silvertooth, et al, 2010; Figure 1). This phenological guideline can be used to identify or predict important stages of crop development that impact physiological requirements. For example, a phenological guideline can help identify stages of growth in relation to crop water use (consumptive use) and nutrient uptake patterns (Figure 3).
This information allows growers to improve the timing of water and N inputs to improve production efficiency. For most crops HU based phenological guidelines can be used to project critical dates such as harvest or crop termination. Many other inputs and applications related to crop management (e.g., pest management) can be derived from a better understanding of crop growth and development patterns.
Arizona chile production, consisting of NM type chile varieties, is mostly located in Cochise County in southeastern Arizona. The 2025 Arizona chile crop has been progressing steadily in line with the basic phenological model shown in Figure 2. For a set of fields near Pearce, Arizona with several different NM type varieties and planting dates ranging from 2 – 22 April 2025, current heat unit accumulations after planting are 1,785 – 1,957 (Figure 4a-d). The crop is moving into peak bloom and the period of peak N and water demand.
This is very good time in the season to evaluate these fields in relation to current irrigation and N fertilization needs.
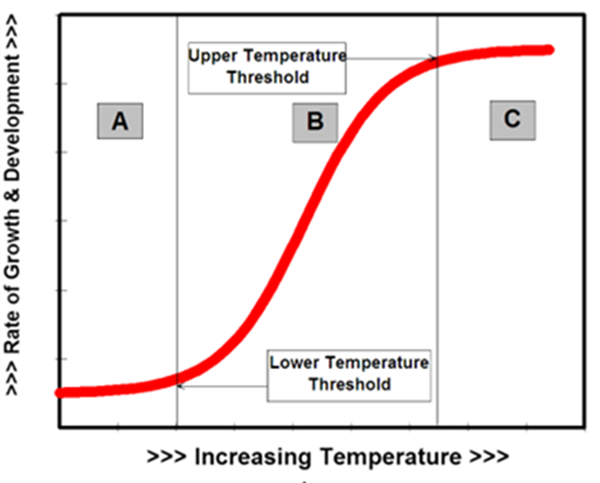
Figure 1. Typical relationship between the rate of plant growth and development and
temperature. Growth and development ceases when temperatures decline below the
lower temperature threshold (A) or increase above the upper temperature threshold (C).
Growth and development increases rapidly when temperatures fall between the lower
and upper temperature thresholds (B).
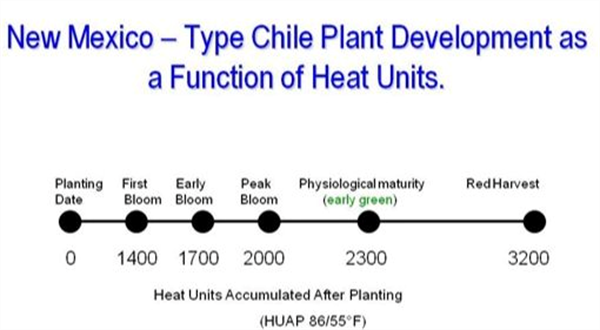
Figure 2. Basic phenological guideline for irrigated New Mexico-type chiles.
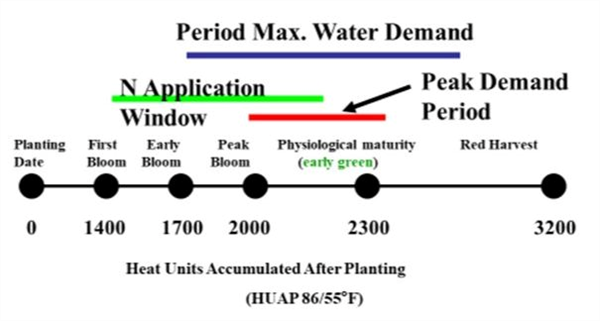
Figure 3. Basic phenological guideline for irrigated New Mexico-type chiles with periods
of peak water and nutrient demand, including optimum N application window.
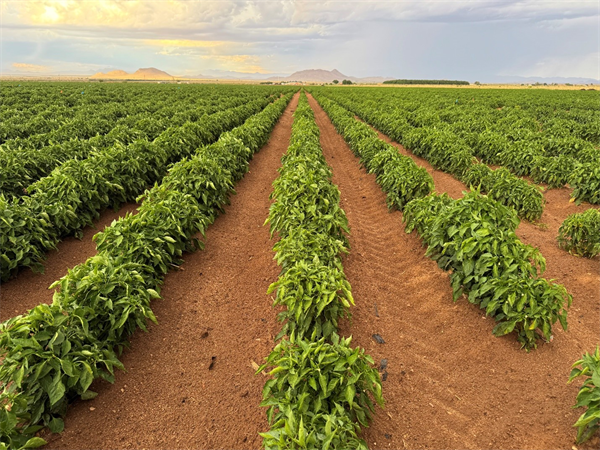
Figure 4a. New Mexico type chile, variety Carne Duro, 31 July 2025.
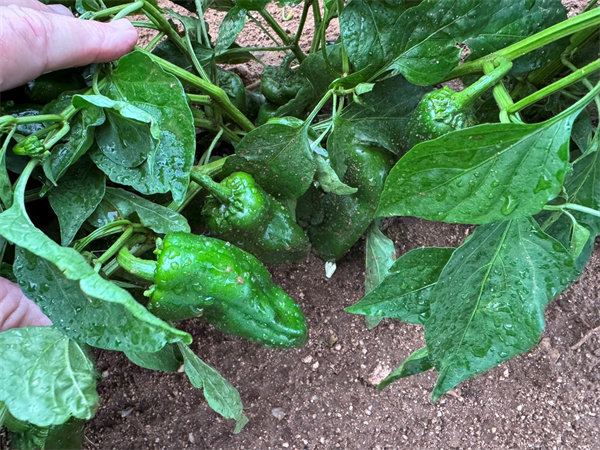
Figure 4b. Crown set chiles, Carne Duro variety, 31 July 2025.
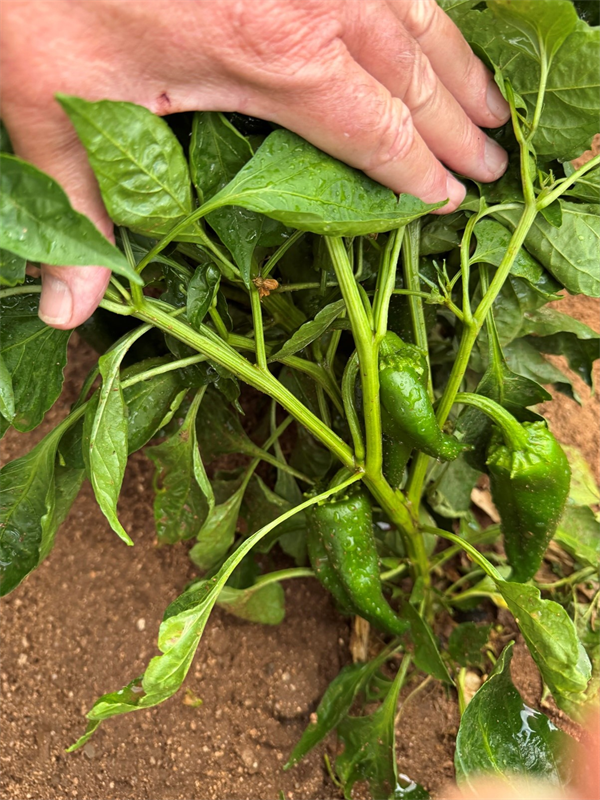
Figure 4c. Early fruit set, Carne Duro variety, 31 July 2025.
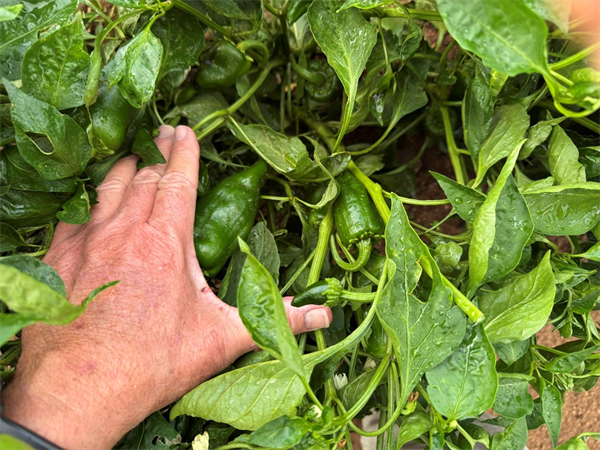
Figure 4d. Mid-canopy fruit set, Carne Duro variety, 31 July 2025.
References
Brown, P. W. 1989. Heat units. Bull. 8915, Univ. of Arizona Cooperative Extension,
College of Ag., Tucson, AZ.
Silvertooth, J.C., P.W. Brown, and S. Walker. 2010.Crop Growth and Development for
Irrigated Chile (Capsicum annuum). University of Arizona Cooperative Extension
Bulletin No. AZ 1529
Soto-Ortiz, R. and J.C. Silvertooth. 2007. A Crop Phenology Model for Irrigated New
Mexico Chile (Capsicum annuum L.) The 2007 Vegetable Report. Jan 08:104-122.
At events and in the halls of the Yuma Agricultural Center, I’ve been hearing murmurings predicting a wet winter this year…
As the Yuma Sun reported last week, “The storms of Monday, Aug. 25 [2025], were the severest conditions of monsoon season so far this year in Yuma County, bringing record-rainfall, widespread power outages and--in the fields--disruptions in planting schedules.”
While the Climate Prediction Center of the National Weather Service maintains its prediction of below average rainfall this fall and winter as a whole, the NWS is saying this week will bring several chances of scattered storms.
These unusually wet conditions at germination can favor seedling disease development. Please be on the lookout for seedling disease in all crops as we begin the fall planting season. Most often the many fungal and oomycete pathogens that cause seedling disease strike before or soon after seedlings emerge, causing what we call damping-off. These common soilborne diseases can quickly kill germinating seeds and young plants and leave stands looking patchy or empty. Early symptoms include poor germination, water-soaked or severely discolored lesions near the soil line, and sudden seedling collapse followed by desiccation.
It is important to note that oomycete and fungal pathogens typically cannot be controlled by the same fungicidal mode of action. That is why an accurate diagnosis is critical before considering treatments with fungicides. If you suspect you have seedling diseases in your field, please submit samples to the Yuma Plant Health Clinic or schedule a field visit with me.
National Weather Service Climate Prediction Center: https://www.cpc.ncep.noaa.gov/
National Weather Service forecast: https://forecast.weather.govFor those interested in in-row weed control, checkout the quality video below (Fig. 1) on how finger weeders (Fig. 2) are being used on a 3,600 acre organic cotton farm in Texas. The grower states that finger weeders help him achieve 95-97% weed control and are a highly cost-effective tool for lowering hand weeding costs.
Fig. 1. Carl Pepper discusses how finger weeders are used to control in-row weeds on
his 3,600 acre organic cotton farm. Click here or on image to view. (Photo credit: Tilmor
LLC, Dalton, OH)

Fig. 2. Finger weeders, an in-row weeding tool, operating in seedling cotton. Finger
weeder pairs are centered on the seed row and overlapped slightly to loosen soil in the
row and uproot small weeds.
Dr. John Palumbo never sought the spotlight, but everything he did—every trial, field visit, and conversation—pointed us toward something better: better science, better decisions, better farming.
I’ve looked up to John since my undergraduate days. He was the model of what I hoped to become: a scientist grounded in integrity, driven by purpose, and deeply connected to the people and land he served. A career-long dream came true when I asked him to join my Ph.D. committee—and he said yes. A defining moment in my journey that I’ll always carry with me.
The work we hoped to do with him is now a reminder of how much he still had to offer. But more than anything, I’m grateful. Grateful that I got to learn from him, talk with him, and be challenged by him. I especially loved when I’d share an idea and he would provide feedback like, “Now I don’t like the sound of that, and I’ll tell you why...” To me that meant he was listening closely. He cared. He was genuine.
John didn’t just give us answers—he gave us perspective and the confidence to ask better questions. His perspective came from a place of hard-earned wisdom which he shared humbly and freely. We’ve lost a giant, but his impact remains in our work, our conversations, and the values he quietly instilled. His presence is deeply missed—and deeply lasting.As the desert vegetable season ramps up, organic growers face tough pest management challenges with limited insecticide options. To help address this, University of Arizona researchers at the Yuma Agricultural Center conducted field trials during the 2024–2025 season, testing OMRI-listed products on six key pests in leafy greens and Brassicas.
This article highlights results for products like Entrust, Pyganic, XenTari, and M-Pede, evaluated for their performance against diamondback moth, beet armyworm, whiteflies, green peach aphid, pale striped flea beetle, and western flower thrips. The results can help growers fine-tune their spray programs and make more informed decisions this season.
Click here to read the full report: Organic-Allowed Insecticide Options for the Management of Six Major Insect Pests in Arizona’s Vegetable CropsAs lettuce season approaches, irrigation management becomes critical for maintaining optimal soil moisture levels in the active root zone. Proper irrigation not only supports healthy crop growth but also prevents excessive water applications that can lead to nitrate leaching, an issue of both environmental concern and economic loss. Likewise, under-irrigation can reduce nitrogen uptake, as adequate soil moisture is essential for root absorption. This is especially critical in an extremely dry region like Yuma, where maintaining optimal soil moisture directly impacts both water and nitrogen use efficiency. This article provides an in-depth guide for growers on how to schedule irrigation based on crop growth stage, system type, and current weather conditions. The article introduces updated crop coefficient (Kc) values developed specifically for Yuma lettuce production through recent field research led by Drs. Sanchez and French, in partnership with Yuma Center of Excellence for Desert Agriculture (YCEDA). It also explains how to use the Arizona Meteorological Network(AZMET) and other practical evapotranspiration tools to make irrigation decisions more precise and site-specific.
Combining updated Kc values, local reference ET data, and irrigation efficiency concepts, this resource empowers growers to improve water use efficiency and sustain high yields and enhance different cropping systems in the region.
Click this link to read the full article: Estimating Crop Evapotranspiration Using Lettuce Crop Coefficients for Irrigation Scheduling in Yuma, Arizona.
Results of pheromone and sticky trap catches can be viewed here.
Corn earworm: CEW moth counts down in most over the last month, but increased activity in Wellton and Tacna in the past week; above average for this time of season.
Beet armyworm: Moth trap counts increased in most areas, above average for this time of the year.
Cabbage looper: Moths remain in all traps in the past 2 weeks, and average for this time of the season.
Diamondback moth: Adults decreased to all locations but still remain active in Wellton and the N. Yuma Valley. Overall, below average for January.
Whitefly: Adult movement remains low in all areas, consistent with previous years.
Thrips: Thrips adults movement decreased in past 2 weeks, overall activity below average for January.
Aphids: Winged aphids are still actively moving, but lower in most areas. About average for January.
Leafminers: Adult activity down in most locations, below average for this time of season.