Norman E. Borlaug completed his Ph.D. in plant pathology at the University of Minnesota in 1942. He worked briefly as a microbiologist for the DuPont de Nemours Foundation. In 1944 he accepted a position as a geneticist and plant pathologist and began work at the International Maize and Wheat Improvement Center (CIMMYT, Centro Internacional de Mejoramiento de Maíz y Trigo) based in Ciudad Obregón, Sonora, Mexico.

Norman Borlaug (left) and his colleague George Harrar in a wheat field in the Yaqui Valley, Sonora, Mexico in 1944.
In joining CIMMYT, Borlaug had the responsibility of organizing and directing the Cooperative Wheat Research and Production Program in Mexico, which was a joint program with the Mexican government & Rockefeller Foundation. This program utilized scientific research in a fully integrated agronomic system utilizing genetics, plant breeding, plant pathology, entomology, soil science, and cereal technology.
The primary objective of Borlaug and his team of colleagues was the development of semi-dwarf varieties of wheat with improved disease resistance, particularly stem rust caused by Puccinia graminis f. sp. tritici (Borlaug, 1968). In the 1940s, Mexico imported a substantial portion of its wheat because of low productivity and severe disease pressure. Within twenty years Borlaug and his team were realizing spectacular success in developing high-yielding short-strawed, diseaseresistant wheat varieties.
One of the key developments by Borlaug and his colleagues was a breeding strategy that combined shuttle breeding between contrasting environments, in this case of the Yaqui Valley of Sonora near Ciudad Obregón, Sonora and Puebla, Mexico with rigorous disease screening. This approach accelerated genetic gains and produced broadly adapted wheat cultivars with durable disease resistance.
Borlaug’s team also developed the incorporation of dwarfing genes into spring wheat varieties. Traditional wheat cultivars commonly developed long stalks and tall plants that were prone to lodging, particularly if provided sufficient water and nitrogen (N) fertilization. This lodging and vegetative growth tendency was limiting yield potential. The new semi-dwarf cultivars allocated more biomass to grain production with a higher harvest index (Pingali, 2012).
The release of two principal varieties, Lerma Rojo 64 and Sonora 64, dramatically increased yields in Mexico and by 1963, Mexico became a net exporter of wheat. Borlaug and the CIMMYT program next directed attention to wheat production in southern Asia and between 1965 to 1970, wheat yields nearly doubled in Pakistan and India, greatly improving food security.
The collective increases in yield from these programs have been labeled the “Green Revolution”, referring to the rapid increase in global agricultural productivity that occurred between the 1940s and the 1970s through the development of improved crop varieties. These developments were especially important in Asia and Latin America, where food shortages and rapid population growth raised concerns regarding widespread famine (Evenson and Gollin, 2003).
The Green Revolution is often credited with saving over a billion people from starvation and in 1970 Borlaug was Awarded the Nobel Peace Prize in recognition of his contributions to world peace through increasing food supply. He is the first and only agronomist to win the Nobel Peace Prize.
The program was a systems approach that consisted of agronomic practices that included improved irrigation, fertilization, and mechanization. Although many scientists, governments, and institutions contributed to the Green Revolution, the work of Norman Borlaug was central to its success.
The Green Revolution developments were also extended beyond wheat. Similar advances occurred in rice breeding through the development of semi-dwarf rice cultivars such as IR8 at the International Rice Research Institute. These plant breeding innovations have contributed to major increases in cereal grains and other crops across many parts of the world in the past 50 years (Khush, 2001).
Borlaug repeatedly and quite emphatically pointed out the fact that their work with the CIMMYT program was only one small step, and it was far from perfect. He consistently encouraged the next generation of agronomists and agricultural scientists to continue working diligently to address food security in the fight against what he often referred to as the “population monster” facing humanity.
Borlaug and the CIMMYT program substantially reduced hunger and demonstrated the importance of science-based agricultural innovation. Due to his contributions to global food security, Borlaug remains widely recognized as one of the most influential agronomists and plant breeders of the twentieth century.
References
Borlaug, N.E. 1968. Wheat breeding and its impact on world food supply. Proc. Third Int. Wheat Genet. Symp. 1:1–36.
Evenson, R.E., and D. Gollin. 2003. Assessing the impact of the Green Revolution, 1960 to 2000. Science 300:758–762. doi:10.1126/science.1078710.
Khush, G.S. 2001. Green revolution: The way forward. Nat. Rev. Genet. 2:815–822. doi:10.1038/35093585.
Pingali, P.L. 2012. Green Revolution: Impacts, limits, and the path ahead. Proc. Natl. Acad. Sci. USA 109:12302–12308. doi:10.1073/pnas.0912953109.
Fall melon season is approaching, and one recurring question I've been hearing is: Will viruses be as bad this fall as they were in the spring?
The incidence and severity of melon viruses this past spring were unprecedented across Yuma County, Imperial County, and northern Mexico. This is supported by the volume of feedback we received from growers, PCAs, and industry representatives who attended the June 2nd melon virus incident response meeting. As a result, predicting what we can expect is going to happen this fall is difficult. We have no recent, if any, experience with virus pressure at this scale in spring melon to guide our expectations for the upcoming fall season. At this point, predictions are more of an educated guess without the guidance of past observations.
To quickly recap, the three main viruses that affected cucurbits this spring were cucurbit yellow stunting disorder virus (CYSDV), cucurbit chlorotic yellows virus (CCYV), and watermelon chlorotic stunt virus (WmCSV). All three are transmitted by the Biotype B whitefly (Bemisia tabaci), whose populations overwintered at unusually high levels between 2025 and 2026. Between melon seasons, these viruses persist in a wide range of crop and weed hosts, many of which show few or no visible symptoms of infection. Unfortunately, these asymptomatic plants can still serve as reservoirs, allowing both the viruses and their whitefly vectors to bridge the melon-free gap between cropping seasons and provide a source of inoculum for newly planted fields. It is an unfortunate reality that neither the whitefly vectors nor many of the alternate host plants (weeds) show symptoms or suffer ill effects while carrying these viruses. As a result, they can stealthily maintain virus populations between melon seasons and serve as a source of infection for newly planted fields.
Below is a compilation of reported host plants for CYSDV, CCYV, and WmCSV. This list reflects the viruses’ confirmed hosts identified to date but is unlikely to be exhaustive. Additional weed and crop species may also be capable of serving as reservoirs for these viruses but have yet to be discovered or reported. Note that many of these plants may grow throughout the region as weeds, native vegetation, commercial crops, or in backyard gardens:
Table 1: Primary and alternate hosts of CYSDV, CCYV, and WmCSV reported to date.

I can see this upcoming melon season unfolding in one of two ways. On one hand, the most intuitive prediction is that the high virus inoculum and abundant whitefly populations present during the spring melon season will carry over into the fall, resulting in early and significant virus pressure. On the other hand, the intensive whitefly management programs implemented throughout the spring may have suppressed vector populations to provide knockdown to pre-winter 2025 levels, resulting in lower virus incidence early in the season than at the start of spring.
Regardless of which scenario plays out, proactive and preventative management of both whiteflies and weed reservoirs remains the most effective strategy for minimizing virus pressure in fall melons. This approach targets two critical stages of the disease cycle by reducing the initial sources of virus inoculum and limiting the whitefly vectors responsible for further virus spread.
Dr. Palumbo developed a management guide for whiteflies and CYSDV in fall melons in 2024. The recommendations are based on research findings from two key publications and provide practical guidance for reducing virus risk throughout the season, from planting through netted fruit (Castle 2017a and 2017b).
Table 2: Insecticide Use Guidelines for Whitefly /CYSDV Management in Fall Melons

The earlier melons become infected with one or more of these viruses, the greater the impact on plant growth, fruit development, and ultimately yield. Even when infection cannot be completely prevented, delaying virus establishment can substantially reduce losses in both yield and fruit quality. Protecting young plants from early whitefly feeding, and virus infection, is therefore one of the most important management objectives to reducing losses.
In field trials comparing at-plant soil applications of flupyradifurone (trade name Sivanto), dinotefuran (Venom), imidacloprid (Admire Pro), and cyantraniliprole (Verimark), Dr. Palumbo and colleagues found that flupyradifurone and dinotefuran provided the greatest protection against both whiteflies and lowest final incidence of CYSDV (Castle et al. 2017b). All products were applied as a single soil shank injection at planting, allowing systemic uptake and protection during crop establishment.
Across both spring and fall trials, flupyradifurone consistently produced the lowest whitefly densities and the lowest incidence of CYSDV. Dinotefuran was the second most effective treatment, significantly reducing both whitefly populations and CYSDV incidence, although its performance was somewhat less consistent than flupyradifurone. In contrast, at-planting treatment with imidacloprid and cyantraniliprole did not consistently reduce CYSDV incidence.
Further reading:
Castle, S., Palumbo, J., Merten, P., Cowden, C. and Prabhaker, N. (2017a), Effects of foliar and systemic insecticides on whitefly transmission and incidence of cucurbit yellow stunting disorder virus. Pest. Manag. Sci., 73: 1462-1472. https://doi.org/10.1002/ps.4478
Castle, S.J., Palumbo, J.P., Merten, P. (2017b), Field evaluation of cucurbit yellow stunting disorder virus transmission by Bemisia tabaci. Virus Res., 241:220-227. doi: https://doi.org/10.1016/j.virusres.2017.03.017
If you have any concerns regarding the health of your plants/crops please consider submitting samples to the Yuma Plant Health Clinic for diagnostic service or booking a field visit with me:
Christopher Detranaltes, Ph.D.
Cooperative Extension – Yuma County
Email: cdetranaltes@arizona.edu
Cell: 602-689-7328
6425 W 8th St Yuma, Arizona 85364 – Room 109
Interested in ag tech? There are a couple of events you won’t want to miss. The first is the Automated Thinning & Weeding Technologies Round-Up being held TOMMOROW, Thursday, November 13th at the Yuma Agricultural Center. As the event name implies, this field day will showcase the latest technologies in automated thinning and weeding equipment operating in the field.
The motivation behind this event is that since last season, there have been several new developments in commercial automated thinning and weeding technologies. Companies that focused primarily on weeding with lasers or spot sprayers have developed new algorithms and/or improved precision so that the machines can now also be used for thinning lettuce. Significant enhancements have also been made to existing lettuce thinning machines that use AI to differentiate between lettuce plants and weeds including improved speed, durability and the ability to spot spray inter-row weeds.
For this year’s field day, we’ve added a twist we think you’ll like. The demos will be at the field scale level (> 1 acre), and most will be 20 minutes long. Approximately one half of the plot will be thinned prior to the event so that attendees can see the end result of the treatment. The other half of the plot will be used for live demonstrations on the day of the event. This format allows attendees to more fully evaluate machine performance and spend time with company representatives.
Registration begins at 7:00 am, breakfast will be served at 7:30 am and the program starts at 7:40 am (agenda below). An abbreviated version of the program will be repeated from 1:00-3:00 pm.
The second event is the two-day Desert Difference: FarmTech Connect. The first day is field day that will be held in conjunction with the Automated Thinning & Weeding Technologies Round-Up. The field days complement each other in that different types of technologies will be displayed at each event. Additionally, abbreviated versions of the 3-hour programs will be repeated from 1-3 pm so you will have the opportunity to see both. The second day is a traditional conference with keynote speakers, lightning talks and a trade show. The conference portion of the event will be held Friday, November 14th at the Yuma County Fairgrounds Legacy Event Center. Details of the Desert Difference: FarmTech Connect conference can be found here.
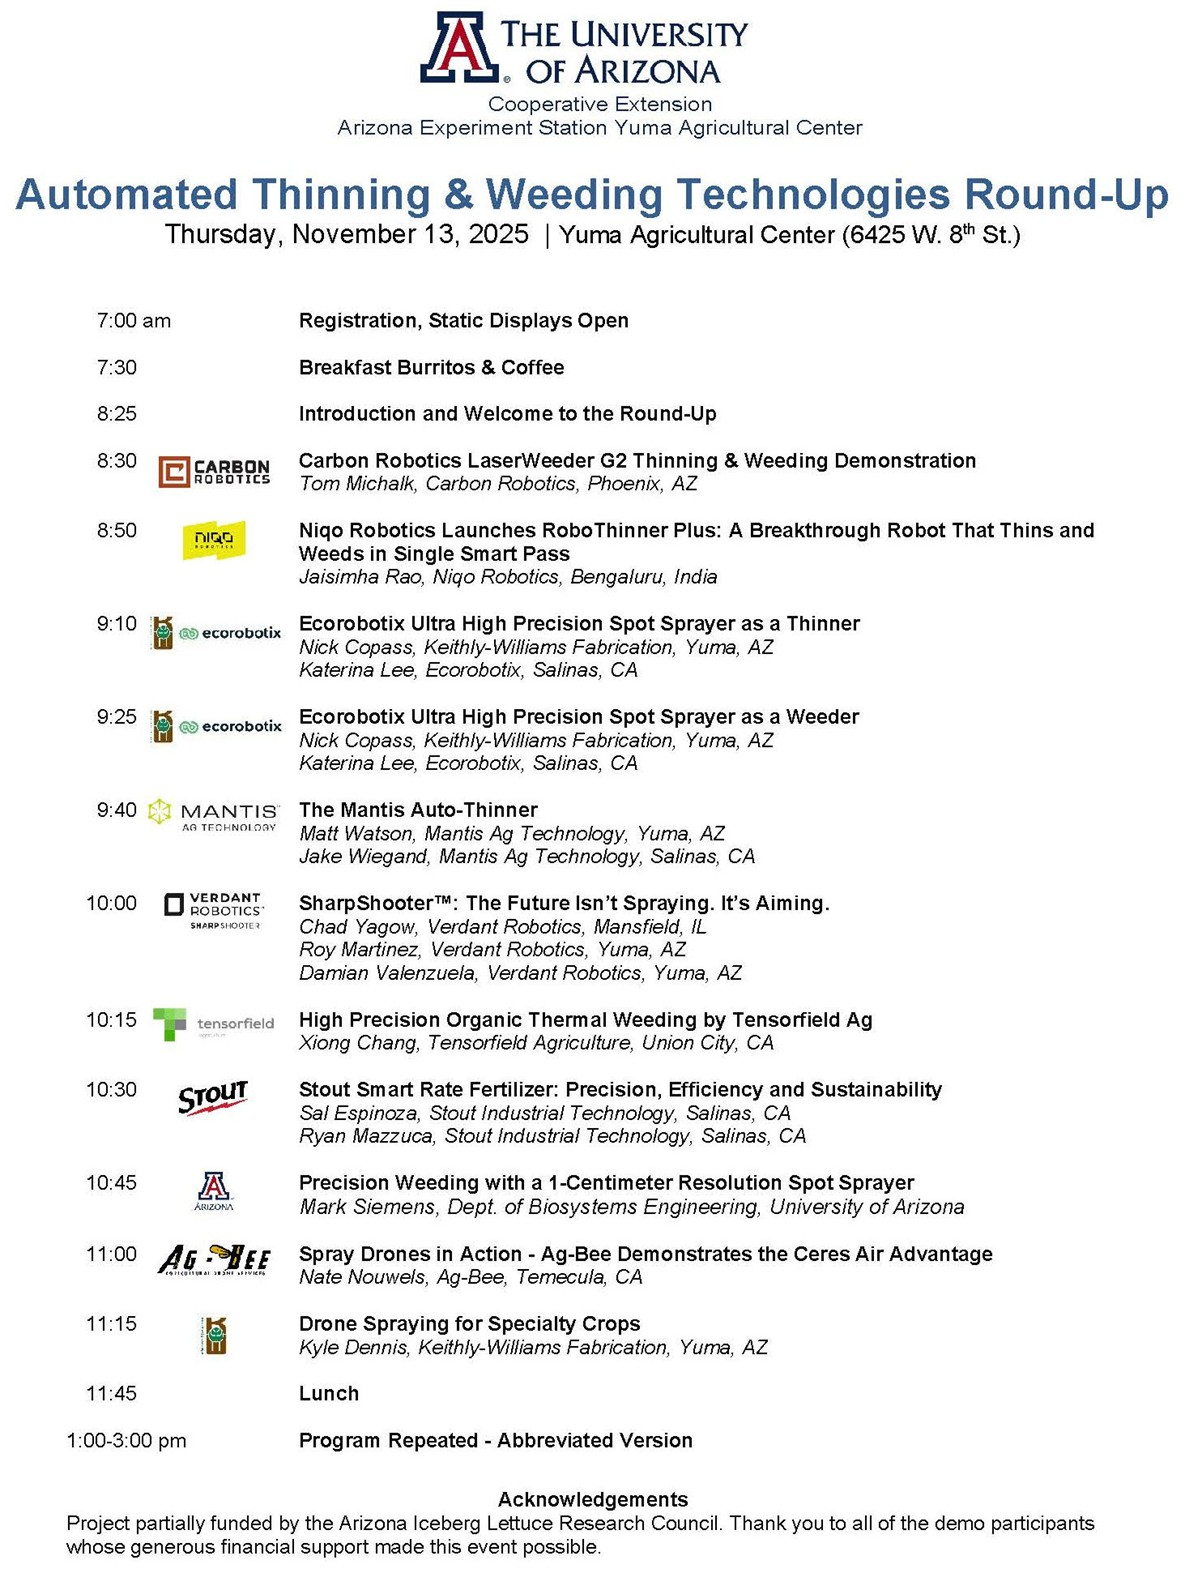
Fig. 1. Agenda for the Automated Thinning & Technologies field day. The event will be
held Thursday, November 13, 2025, at the Yuma Agricultural Center, 6425 W. 8th St.,
Yuma, AZ.

Fig. 2. Exhibitors and field day agendas for The Desert Difference: FarmTech Connect
and Automated Thinning & Weeding Technologies concurrent events being held
November 13, 2025, at the Yuma Agricultural Center, 6425 W. 8th St., Yuma, AZ.
Weed control in wheat and barley in the Southwestern United States faces significant challenges, including high winter temperatures, extensive irrigation, and limited crop rotation options. Although wheat and barley are naturally competitive crops, research indicates that weeds can reduce yields, hinder harvesting, increase grain impurities, cause grain discoloration, and lead to insect or mold problems during storage if not managed effectively.
An Integrated Pest Management (IPM) approach—which combines prevention, cultural practices, and the appropriate use of herbicides—offers the most sustainable and reliable weed control within wheat production systems in low-desert regions.
Focus on Early Control
Weeds that emerge simultaneously with the wheat crop, or shortly thereafter, cause the greatest yield losses. Weed species typically include annual ryegrass, wild oats, Italian ryegrass, Canarygrass species, London rocket, various mustard species, and Fiddleneck. Fields should be free of weeds at the time of planting and must be kept clean until the onset of the tillering stage.
Cultural Practices Remain Essential
Recommended Herbicide Programs (Examples of Options)
Note: Always follow the instructions on the product label specifically for your state, wheat variety, soil type, and growth stage. The rates listed below reflect ranges commonly used in the Southwestern United States.
OR
OR
OR
Resistance and Integrated Pest Management (IPM) Considerations
Rotate the use of multiple effective herbicides.
Recommended Reading
Growers and PCAs are strongly encouraged to review the following foundational reference guide for additional details regarding weed biology, application timing, and appropriate herbicide options for Arizona’s low deserts:
Bottom Line
Successful weed management in wheat and barley crops across the Southwestern United States relies on early-season management, high crop competitiveness, and the timely and appropriate application of herbicides. Integrating extension-based cultural practices with weed management programs that are mindful of herbicide resistance remains the most effective strategy for safeguarding both crop yield and grain quality.
Extension Support and Collaboration
I am more than happy to conduct field visits, assist with weed identification and management decisions, or collaborate on herbicide efficacy trials targeting weed problems in wheat and barley. Please feel free to reach out to discuss on-farm visits or research opportunities.
Diamondback moth (DBM), Plutella xylostella, is one of the most important insect pests of Brassica crops, including cabbage, broccoli, cauliflower, and some leafy greens. Heavy infestations can cause significant feeding damage, reduce crop quality, and increase production costs. Because DBM has a long history of developing resistance to insecticides, regular monitoring of insecticide susceptibility is essential to ensure effective management in the field. In the western United States, resistance to several key insecticide classes has been documented in field populations. For example, populations in California have shown high levels of resistance to several insecticide classes, including diamides, spinosyns, avermectins, pyrethroids, and Bacillus thuringiensis (Bt) products. More recently, outbreaks in Arizona have been associated with confirmed resistance to diamide insecticides and reports of reduced field efficacy. This highlights the importance of regular insecticide susceptibility monitoring and the implementation of resistance management strategies to maintain effective control of the pest. While field resistance and reduced efficacy reflect outcomes under production conditions, laboratory susceptibility monitoring provides a standardized approach to detect shifts in population response before or alongside observable field control issues.
To evaluate current insecticide susceptibility levels in DBM populations across Arizona's major Brassica-growing regions and some California populations, DBM larvae were collected from multiple locations in Arizona and California. DBM populations were reared in the laboratory, and their progenies were tested under controlled laboratory conditions.
In the laboratory, larvae were exposed to insecticides at the highest labeled field rate using a leafdip bioassay. The insecticides evaluated included Exirel®, Coragen®, Harvanta®, Radiant®, Baythroid® XL, Proclaim®, Torac®, DiPel®, and XenTari®, representing commonly used conventional and organic management options, as well as IncipioTM, which was recently registered. These laboratory bioassays measure relative susceptibility under controlled conditions using field-collected populations reared in the laboratory. Results represent mortality at the maximum labeled rate under leaf-dip assay conditions and may not directly reflect field performance, where environmental conditions, application timing, coverage, larval stage, and population dynamics influence control. These data are intended to monitor susceptibility trends and help inform resistance management decisions. Accordingly, extrapolation to field performance should be made cautiously, recognizing both the constraints of laboratory bioassays and the mosaic of susceptibility that may exist within and among field populations.
Several Insecticides Showed High Laboratory Mortality Across Field-Collected Populations
Several of the insecticides evaluated caused high mortality of DBM larvae in laboratory assays across field populations. Proclaim, Incipio, Radiant, DiPel, and XenTari caused high mortality, indicating laboratory susceptibility across the tested populations. These products remain promising options for managing DBM in Brassica crops based on current laboratory susceptibility data. In contrast, Coragen, Exirel, and Baythroid XL resulted in lower mortality in laboratory assays than the other insecticides (Figure 1).

Figure 1. Mean mortality (%) of DBM larvae exposed to the maximum label rate of
insecticides, combined across 10 field populations from California and Arizona.
DBM Mortality by Collection Location, with Some Population-Level Variability
The levels of larval mortality caused by each evaluated insecticide were generally consistent across populations. For DBM populations collected during fall 2025, Proclaim, Incipio, Radiant, DiPel, and XenTari resulted in high larval mortality under laboratory assay conditions for most DBM populations tested (Figure 2). However, slight reductions in larval mortality were observed in specific populations. For example, DiPel resulted in approximately 70% larval mortality in the Coachella Valley, CA population # 4, and Radiant caused approximately 55% larval mortality in the Coachella Valley, CA population #2. Despite this variability, these insecticides generally resulted in high mortality of DBM larvae across geographic locations under laboratory assay conditions (see Figure 1). In contrast, Coragen, Exirel, and Baythroid XL consistently resulted in low DBM larvae mortality in the field-collected populations from Salinas Valley, CA; Coachella Valley, CA; and Gila Valley, AZ (Figure 2).
We observed similar mortality trends among populations collected during winter/spring 2026 for the evaluated insecticides except for DBM mortality caused by Dipel, which declined in many populations (Figures 3 and 4). Harvanta was evaluated for two populations (Imperial Valley, CA and Somerton, AZ), which exhibited similar reduced larval mortality to that of the other diamides. Torac was also evaluated for the Imperial Valley, CA, population, resulting in a high level of DBM mortality (Figure 4). We also tested a population collected from the Yuma Ag Center, which resulted in susceptibility levels very similar to those of the susceptible laboratory colony (Figure 3). Previous DBM monitoring studies performed by Dr. Palumbo over several years also showed that while populations collected from commercial fields showed very low susceptibility to diamides, populations collected at the Yuma Ag Center remained highly susceptible. This indicates that transplant sources and/or field-specific DBM management practices are also affecting DBM susceptibility and control across Arizona’s brassica-growing regions.
The reduced and variable levels of larval mortality observed in laboratory assays across multiple field populations for some tested insecticides highlight the importance of routine susceptibility monitoring to better understand resistance dynamics and to support informed field-level decisions regarding product selection and rotation.

Figure 2. Mortality (%) of DBM larvae from field populations collected from Arizona
and California as affected by maximum label rates of 8 insecticides, Fall 2025.

Figure 3. Mortality (%) of DBM larvae from a susceptible lab colony and field
populations collected from Arizona as affected by maximum label rates of 8
insecticides, Winter/Spring 2026.

Figure 4. Mortality (%) of DBM larvae from two field populations collected from
Arizona and California as affected by maximum label rates of ten insecticides, Spring 2026.
Key Laboratory Findings
Implications for Resistance Monitoring and Field Decision-Making
Laboratory monitoring informs our understanding of resistance trends, but field scouting remains essential to evaluate how populations respond under production conditions. As always, when in doubt, scout!
Additional Reading Materials
If you have ever watched a well-irrigated field show signs of stress during a hot, dry afternoon, you have seen the effects of Vapor Pressure Deficit (VPD) in action. While growers often focus on temperature, humidity, evapotranspiration (ET), and soil moisture when making irrigation decisions, VPD provides another valuable piece of information: how strongly the atmosphere is pulling water from the crop.
What Is VPD?
Vapor Pressure Deficit (VPD) is the difference between the amount of moisture the air can hold when fully saturated and the amount of moisture actually present in the air. In simple terms, VPD measures the atmosphere's demand for water. VPD is determined by both air temperature and relative humidity. As temperatures rise and humidity decreases, VPD increases. Conversely, cooler temperatures and higher humidity result in lower VPD values. Because VPD integrates the effects of both temperature and humidity, it often provides a better indication of crop water demand than either variable alone. Two days with the same air temperature can place very different demands on a crop if humidity levels differ substantially.
Why VPD Matters for Irrigation Management
Among its many applications, VPD is particularly valuable for irrigation management. Higher VPD values increase transpiration, causing crops to lose water more rapidly through their leaves. As atmospheric demand increases, crops require greater water uptake from the root zone to maintain normal physiological functions. For this reason, VPD can help explain why crop water requirements may change from day to day, even when temperatures appear similar. Monitoring VPD alongside ET estimates and soil moisture measurements can improve irrigation scheduling and help growers maintain adequate soil moisture during periods of elevated atmospheric demand. When VPD remains high for several consecutive days, crops may experience substantial increases in water use. Understanding these conditions can help growers anticipate periods of increased irrigation demand and make more informed water management decisions.
VPD and Crop Performance
VPD directly influences crop growth, productivity, and physiological performance. Under favorable conditions, plants maintain open stomata that allow carbon dioxide to enter the leaf for photosynthesis while water vapor exits through transpiration. This process supports plant cooling, nutrient transport, and biomass production. However, when VPD becomes excessively high, plants often respond by partially closing their stomata to reduce water loss. Although this protective mechanism conserves water, it also limits carbon dioxide uptake and photosynthesis. Prolonged exposure to high VPD conditions can reduce growth rates, decrease biomass accumulation, and negatively affect yield and crop quality.Conversely, extremely low VPD conditions can suppress transpiration and reduce nutrient movement within the plant. As a result, both excessively low and excessively high VPD conditions can influence crop performance.
VPD and Integrated Pest Management (IPM)
VPD can also provide useful insight into environmental conditions that influence pest and disease development. Low VPD conditions are typically associated with higher humidity and longer periods of leaf wetness. These conditions may favor the development of fungal and bacterial diseases in susceptible crops. High VPD conditions, on the other hand, can increase plant stress and influence crop susceptibility to certain insect pests and other environmental stresses. While VPD alone does not predict pest outbreaks, it helps explain environmental conditions that affect crop health and pest dynamics. Integrating VPD information into crop monitoring programs can therefore support both irrigation and IPM decision-making.
Seasonal VPD Patterns in Yuma
To better understand VPD conditions in the lower Colorado River region, daily weather data from the Yuma Valley AZMet station were analyzed from January 2020 through May 2026. The analysis revealed a remarkably consistent seasonal pattern (Figure 1). The 2020–2025 monthly mean VPD ranged from a low of 0.91 kPa during January and December to a peak of 3.78 kPa in July.
Atmospheric demand increased steadily during spring, rising from 1.33 kPa in March to 2.50 kPa in May. The highest VPD values occurred during the summer months, with June through August averaging between 3.41 and 3.78 kPa.
For practical purposes, these seasonal patterns can be grouped into four production periods (Table 1). Winter months experience relatively low atmospheric demand, while summer months are characterized by extremely high evaporative demand. The difference in atmospheric demand between winter lettuce production and summer crop production is more than three-fold.
March 2026 provides an example of why monitoring current conditions remains important. The monthly average VPD reached 2.39 kPa, approximately 80% above the long-term March average of 1.33 kPa. Growers relying solely on historical expectations would have underestimated crop water demand during that period.

Table 1. Seasonal VPD Conditions in Yuma

Figure 1. Monthly mean vapor pressure deficit (VPD; kPa) at the Yuma Valley AZMet station from January 2020 through May 2026. Colored lines represent individual years, while the dashed black line indicates the 2020–2025 monthly mean. Higher VPD values indicate greater atmospheric demand for water and increased crop transpiration. June 2026 was excluded because only 8 of 30 days were available.
The Success of Yuma Growers
Perhaps the most remarkable aspect of these findings is not the magnitude of VPD itself, but the ability of Yuma growers to consistently produce high-quality crops under some of the most challenging atmospheric conditions for agriculture in North America. Summer VPD values in Yuma routinely approach 4 kPa, reflecting an environment where the atmosphere exerts an intense demand for water. Despite these conditions, Yuma growers continue to achieve exceptional productivity through efficient irrigation systems, precise water management, and decades of agronomic expertise. Their success demonstrates that agricultural productivity and water conservation can go hand in hand. Through innovation, adoption of advanced irrigation technologies, careful scheduling, and science-based management practices, Yuma growers continue to produce more crop per drop while maintaining the region's position as one of the most productive agricultural areas in the nation.
Data source: Arizona Meteorological Network (AZMet), Yuma Valley station, University of Arizona Cooperative Extension (azmet.arizona.edu).
VegIPM Update Vol. 17, Num. 14
July 8, 2026
Results of trap catches below!!
Whitefly: Adult activity remains steady across locations; above average for this time of the year. Historically, whitefly numbers peak in July.
Thrips: Adult thrips activity decreased over the last two weeks. About average for this time of the year. Historically, thrips numbers remain low until Sept-Oct.
Diamondback Moth: No diamondback moths have been collected in the traps since May 19th. Based on the past six years summer collection data, no DBM is collected in the traps in the summer months (Jun-Aug) until September.