In a recent edition of this University of Arizona Vegetable Integrated Pest Management (UA VIPM) Newsletter, Vol. 14, No. 18, I provided a brief review of some basics related to soil physical properties and soil health. Physical properties have strong impacts on some basic functions of healthy soil. In irrigated agriculture one important physical feature is that of water holding capacity and the plant-available water (PAW) a soil can hold (Baver et al., 1972).
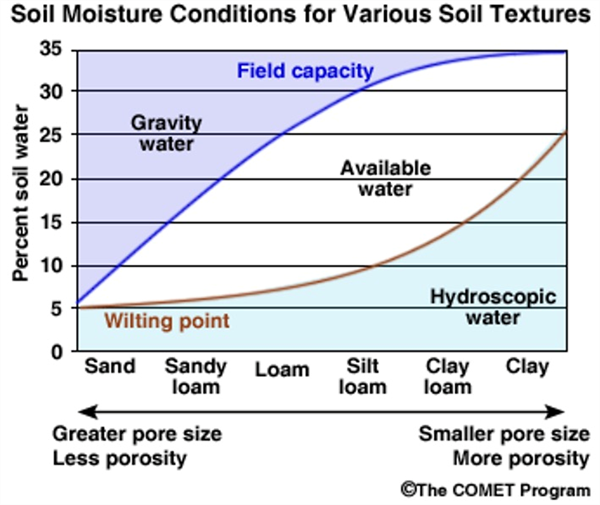
Soil serves as the storehouse or reservoir of water available for plant uptake. As noted in the article regarding soil physical properties, soils vary significantly in terms of texture (relative proportions of sand, silt, and clay) and water holding capacity. The relationship between total water in a soil and the portion of that water that is “available” to plants is shown in Figure 1 and Table 1.
In review of Figure 1, it is important to note several points: 1) The total amount of water that can held by a soil increases with finer textured soils. 2) The PAW held in a soil generally increases with finer textured soils but only to a certain extent with a salient bulge of maximum proportions of PAW in medium textured soils, such as loams and silt loams. 3) Soils with higher clay content, e.g. clay loams and clays, have high total water holding capacity but lesser amounts of PAW (Kirkham, 2023).
Water that is held very tightly by the soil particles is referred to as “hydroscopic” water and the finer soil particles, such as clay, exert the strongest hydroscopic forces, and holding that soil-water unavailable to most plants.
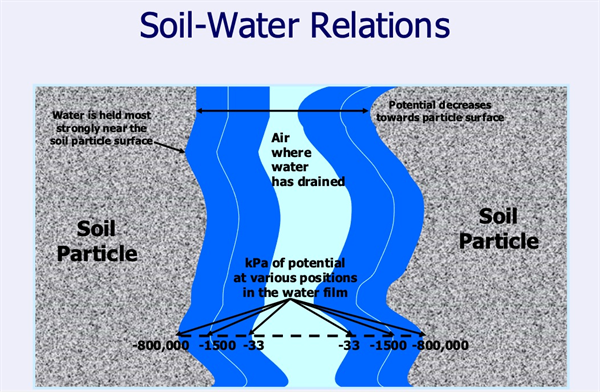
The lower boundary of PAW shown in Figure 1 is a general line of demarcation at -1500 kilopascals (kPa) of potential energy and is referred to as the permanent wilting point (PWP). The PWP was originally considered as a more universal limit among plant species (Briggs and Shantz, 1912). However, the PWP as defined in Figure 1 is very general since all plant species vary considerably in their capacities to extract water from the soil. Many native desert plant species for example can extract some hydroscopic and most crop species will suffer water stress long before soil-water content approaches the PWP line shown in Figure 1 (van Lier et al. 2023).

Figure 1. Soil-water holding capacity as a function of soil texture. Source: The
COMET program. University Corporation of atmospheric research.

Figure 2. Soil-water relations and energy levels with soil-water content,
kilopascals (kPa) of potential energy.
Figure 2 describes a close-up view of two adjacent soil particles and the pore space between them. Soil-water is held as a film around the soil particles leaving some air space in the pores after the gravitational water has drained away, leaving the soil at field capacity (FC). As the soil dries the water film on the soil particles become thinner and held more strongly by the physical forces associated with the soil particles.
Following irrigation with the gravitational water drained away (dependent upon good internal soil drainage), which commonly takes about 24 hours, a soil will be at FC. A crop will extract water most easily at FC and can continue to do so until the soil dries to a point where the crop plant can no longer pull water from the soil against the forces of the soil exerting holding that water.
That critical point below which plants begin to encounter water stress is unique among crop plants but for most leafy green vegetable crops this limit is commonly about the 65-70% PAW level. Other common desert crops like alfalfa, cotton, wheat, and melons can maintain adequate water levels before stressing and starting to show signs of wilting at approximately 55% PAW.
This means the actual range of soil-water that is available to plants is in the range from FC to the specific point of crop stress level, that is unique to each crop species, and the corresponding wilting point (WP). Thus, PAW = FC – WP.
One of our challenges in managing crop production systems is identifying the WP for the crop in question and FC for the soil in that field. In addition, with irrigation management we strive to maintain crops in a non-stressed condition and manage the fields in that range of PAW between the FC of the soil and the WP for the crop.
This is a good example of a healthy soil that does not limit water availability due to physical or chemical restrictions and benefits the growth of a healthy crop.
The Web Soil Survey in the following link can be used to assess soil textures dominant in a given field. https://websoilsurvey.nrcs.usda.gov/app/
|
Texture |
AWC range (in/in) |
AWC range (in/ft) |
Est. typical AWC (in/ft) |
|
Coarse sand |
0.01-0.03 |
0.1-0.4 |
0.25 |
|
Sand |
0.01-0.03 |
0.1-0.4 |
0.25 |
|
Fine sand |
0.05-0.07 |
0.6-0.8 |
0.75 |
|
Very fine sand |
0.05-0.07 |
0.6-0.8 |
0.75 |
|
Loamy coarse sand |
0.06-0.08 |
0.7-1.0 |
0.85 |
|
Loamy sand |
0.06-0.08 |
0.7-1.0 |
0.85 |
|
Loamy fine sand |
0.09-0.11 |
1.1-1.3 |
1.25 |
|
Loamy very fine sand |
0.10-0.12 |
1.0-1.4 |
1.25 |
|
Coarse sandy loam |
0.10-0.12 |
1.2-1.4 |
1.3 |
|
Sandy loam |
0.11-0.13 |
1.3-1.6 |
1.45 |
|
Fine sandy loam |
0.13-0.15 |
1.6-1.8 |
1.7 |
|
Very fine sandy loam |
0.15-0.17 |
1.8-2.0 |
1.9 |
|
Loam |
0.16-0.18 |
1.9-2.2 |
2 |
|
Silt loam |
0.19-0.21 |
2.3-2.5 |
2.4 |
|
Silt |
0.16-0.18 |
1.9-2.2 |
2 |
|
Sand clay loam |
0.14-0.16 |
1.7-1.9 |
1.8 |
|
Clay loam |
0.19-0.21 |
2.3-2.5 |
2.4 |
|
Silty clay loam |
0.19-0.21 |
2.3-2.5 |
2.4 |
|
Sandy clay |
0.15-0.17 |
1.8-2.0 |
1.9 |
|
Silty clay |
0.15-0.17 |
1.8-2.0 |
1.9 |
|
Clay |
0.14-0.16 |
1.7-1.9 |
1.8 |
Table 1. Available Water Capacity (AWC), range, and typical levels for various soil textures. Source: Chapter 2 “Soils”, Irrigation Guide, Natural Resources Conservation Service- National Engineering Handbook.
References
Baver, L.D., Gardner, W.H., and Gardner, W.R. 1972. Soil Physics. 4th ed. Wiley: New York.
Briggs, L.J., and Shantz, H.L. 1912. The wilting coefficient for different plants and its indi-rect determination. USDA Bur Plant Industry Bull No. 230. U.S. Dept. Agr: Washington, DC.
Kirkham, M.B. 2023. Field capacity, wilting point, available water, and the non-limiting water Range. Ch. 8. In: Principles of Soil-Plant-Water Relations. 2023 Elsevier Ltd.
“Soils”, Irrigation Guide, Natural Resources Conservation Service- National Engineering Handbook.https://directives.sc.egov.usda.gov/OpenNonWebContent.aspx?content=17837.wba
van Lier, Q. J., S.D. Logsdon, E. A. Rodrigues, and P.I. Gubianid, Plant-Available Water. Ch. 12. In: Principles of Soil-Plant-Water Relations. 2023 Elsevier Ltd.
I hope you are frolicking in the fields of wildflowers picking the prettiest bugs.
I was scheduled to interview for plant pathologist position at Yuma on October 18, 2019. Few weeks before that date, I emailed Dr. Palumbo asking about the agriculture system in Yuma and what will be expected of me. He sent me every information that one can think of, which at the time I thought oh how nice!
When I started the position here and saw how much he does and how much busy he stays, I was eternally grateful of the time he took to provide me all the information, especially to someone he did not know at all.
Fast forward to first month at my job someone told me that the community wants me to be the Palumbo of Plant Pathology and I remember thinking what a big thing to ask..
He was my next-door mentor, and I would stop by with questions all the time especially after passing of my predecessor Dr. Matheron. Dr. Palumbo was always there to answer any question, gave me that little boost I needed, a little courage to write that email I needed to write, a rigid answer to stand my ground if needed. And not to mention the plant diagnosis. When the submitted samples did not look like a pathogen, taking samples to his office where he would look for insects with his little handheld lenses was one of my favorite times.
I also got to work with him in couple of projects, and he would tell me “call me John”. Uhh no, that was never going to happen.. until my last interaction with him, I would fluster when I talked to him, I would get nervous to have one of my idols listening to ME? Most times, I would forget what I was going to ask but at the same time be incredibly flabbergasted by the fact that I get to work next to this legend of a man, and get his opinions about pest management. Though I really did not like giving talks after him, as honestly, I would have nothing to offer after he has talked. Every time he waved at me in a meeting, I would blush and keep smiling for minutes, and I always knew I will forever be a fangirl..
Until we meet again.
Please watch a demonstration of a spray assembly delivering herbicidal spray (blue dye) to spot spray targeted weeds. The device will be integrated with an imaging system for precision, automated / robotic weed control. Weed targets and crop plants are indicated on paper by green and yellow squares respectively. The same targeting pattern is used for simulated weeds (small plastic plants) and crop plants (white roses). Off target spray on paper is due to liquid splashing on a hard surface and is not observed on plastic weed targets. The travel speed is 2 mph and nozzle height - 5".
Click on the following demonstration link or the picture area: