In a world of increasing costs associated with about everything we do, there is some good news in the international fertilizer market. In response, we can begin to anticipate changes in fertilizer costs at the field level.
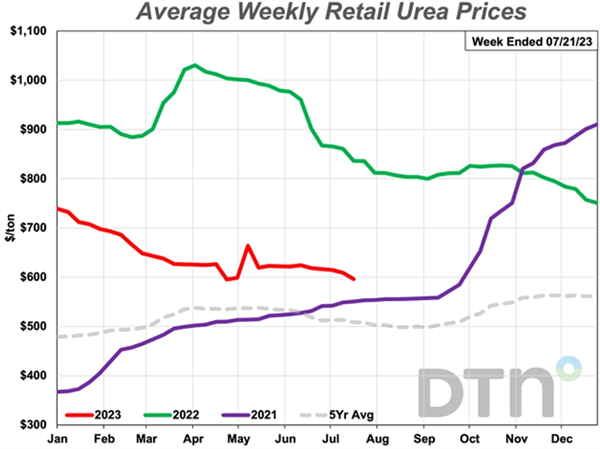
International fertilizer prices began to experience sharp increases in 2021 due to a series of supply shocks, weather patterns, fertilizer production plant closures, an imperfectly competitive and shallow market structure, and a series of policy changes that resulted in significant price volatility and a drop in fertilizer affordability. Since then, higher prices of fertilizers have been a challenge globally and it has certainly impacted our crop production systems of the desert Southwest (Figure 1).
Some of the fertilizer and grain trade flow issues we have recently experienced developed in relation to the Russian conflict with Ukraine that began in February 2022 and the resultant tensions in the region. Economic sanctions have been imposed on Russia, inflation has been increasing fertilizer prices and transportation, and other pandemic-related complications have contributed to transportation logistical challenges. But the Russian-Ukrainian conflict has not been the sole cause of the international fertilizer price increases.
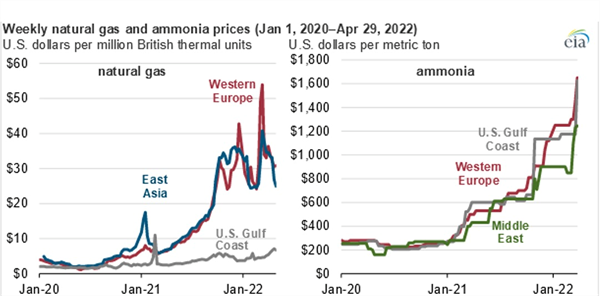
Some production and supply reductions experienced in the European, Chinese, and Russian segments of the global fertilizer industry have been caused by sharp increases in production costs. For example, prices of natural gas and ammonia in Europe, Russia, and in China have increased along with high prices for coal which have created reductions in electricity production and consequential disruptions in the fertilizer industry, which is energy intensive. The Chinese reduced fertilizer exports in 2021 because of these reductions in fertilizer production and supply (Figure 2; Raghuveer and Wilczewski, 2022).
Despite the difficulties in the international fertilizer market in the past 18 months, there are some promising recent trends. In the past several months international fertilizer prices have come down to levels close to those experienced in early 2021. Even considering the recent declines in the international fertilizer prices, they are not expected to drop below pre-pandemic levels, primarily due to global inflation that generates an increase in production and transportation costs (Figure 1; Quinn, 2023).
By the end of July 2023, anhydrous ammonia (82-0-0) was 6% lower in late July than a month earlier with an average price of $713/ton. Among the other major fertilizer materials, diammonium phosphate (DAP) had an average price in late July of $807 per ton, monoammonium phosphate (MAP) $812/ton, potash (primarily muriate of potash, KCl) was $608/ton, urea (45-0-0) $596/ton, liquid ammonium polyphosphate (10-34-0) $717/ton, urea ammonium nitrate (UAN28) $385/ton, and a higher N concentration form of UAN32 was $457/ton.
It is important to note that urea ammonium nitrate (UAN) is 28% N in some materials and 32% N in another common form. Also, monoammonium phosphate (MAP) can have N concentrations of 10-12% and P2O5 concentrations of 48-61%, with 11-52-0 being the most common dry form in the market.
On a percentage basis, urea (46-0-0) is 29% less expensive than a year ago, potash fertilizers are now 31% lower, urea ammonium nitrate (UAN32) is 34% less expensive and another form with 28% N (UAN28) is 36% lower, and anhydrous is 50% less expensive compared to last year. Monoammonium phosphate (11-52-0) is now 22% lower and diammonium phosphate (DAP) 18-46-0 and ammonium polyphosphate (10-34-0) are 20% lower in price.
Urea (46-0-0) has recently dropped below the $600/ton to $585/ton for the first time since late September 2021. Anhydrous ammonia (82-0-0) has had an average price recently of $713/ton, which is down about 9% in price from April 2023. Muriate of potash (KCl, 0-0-60) had an average price in the past month of $608/ton, ammonium polyphosphate (10-34-0) average price has been $717/ton, and urea ammonium nitrate (UAN-32, 32-0-0) average price has been $457/ton this past month. Urea ammonium nitrate (UAN-28, 28-0-0) price has dropped to an average of $385/ton.
When considering nitrogen (N) fertilizer prices in terms of the price per pound of N, recent urea (45-0-0) prices averaged $0.65/lb.N, anhydrous ammonia (82-0-0) $0.44/lb.N, urea ammonium nitrate (UAN28) $0.69/lb.N and urea ammonium nitrate with 32%N (UAN32) is now $0.71/lb.N.
Hopefully, the trajectory of fertilizer prices experienced in the past 18 months will continue and the average costs may return to levels close to 2021 (Figure 1). However, international logistics in the fertilizer industry, including shipping, transfer, and distribution of fertilizer cargo continue to be very important in the fertilizer markets and any projections for the future. Market and transportation issues in the Black Sea region and limitations in the exportation of fertilizer materials from the western ports of Canada due to labor issues, primarily affecting potassium fertilizers, are still important factors to watch.

Figure 1. Average weekly retail prices for anhydrous ammonia (82% N), for 2021,
2022, and through 21 July 2023. Source: DTN/Quinn, 2023.

Figure 2. General relationship between weekly natural gas and ammonium
fertilizer prices, 2020-2022. Source: T. Raghuveer and W. Wilczewski. U.S.
Energy Information Administration.
References:
Quinn, R. 2023. DTN Retail Fertilizer Trends: Fertilizer prices moving in two directions. DTN Newsletter, 26 July 2023. https://www.dtnpf.com/agriculture/web/ag/crops/article/2023/07/26/urea-drops-600-per-ton-first-time
T. Raghuveer and W. Wilczewski. 2022. U.S. ammonia prices rise in response to higher international natural gas prices. U.S. Energy Information Administration. https://www.eia.gov/todayinenergy/detail.php?id=52358#
Frost and freeze damage affect countless fruit and vegetable growers leading to yield losses and occasionally the loss of the entire crop. Frost damage occurs when the temperature briefly dips below freezing (32°F).With a frost, the water within plant tissue may or may not actually freeze, depending on other conditions. A frost becomes a freeze event when ice forms within and between the cell walls of plant tissue. When this occurs, water expands and can burst cell walls. Symptoms of frost damage on vegetables include brown or blackening of plant tissues, dropping of leaves and flowers, translucent limp leaves, and cracking of the fruit. Symptoms are usually vegetable specific and vary depending on the hardiness of the crop and lowest temperature reached. A lot of times frost injury is followed by secondary infection by bacteria or opportunist fungi confusing with plant disease.
Most susceptible to frost and freezing injury: Asparagus, snap beans, Cucumbers, eggplant, lemons, lettuce, limes, okra, peppers, sweet potato
Moderately susceptible to frost and freezing injury: Broccoli, Carrots, Cauliflower, Celery, Grapefruit, Grapes, Oranges, Parsley, Radish, Spinach, Squash
Least susceptible to frost and freezing injury: Brussels sprouts, Cabbage, Dates, Kale, Kohlrabi, Parsnips, Turnips, Beets
More information:
Fig. 1. Finger weeders removing a large, in-row Palmer Amaranth plant in cotton – slow motion video. (Video credit: Kyle R. Russel, Texas A&M University. Cultivator design and setup credit: Carl Pepper, Lubbock, TX). Click here or on the image to see the video.
We have recently received winter grass samples for identification and one of the most common has been Annual Bluegrass (Poa annua). Native to Europe it is distributed worldwide we find it invading homeowner landscapes, golf courses, and agricultural fields. It reproduces only by seeds1 and can have several generations per year. The leaf blades are about 3 in long and plants are about 4 to12 inches tall. The flowering part is about 1to 4 inches long There are several species of the genus Poa but we included in this article the most typical characteristics of the Poa annuaspecies3.
Please check the highlighted features of this grass in the illustrations below:
When leaves are looked through light two transparent lines on both sides of the midrib can be seen 2

Figure1. Key characteristics of annual bluegrass. (Images: M. Peña and Jim
Converse Proturf Guide to the Identification of grasses).

Figure 2. Proturf Guide to The Identification of Grasses, Jim Converse
References:
Results of pheromone and sticky trap catches can be viewed here.
Corn earworm: CEW moth counts remain at low levels in all areas, well below average for this time of year.
Beet armyworm: Trap increased areawide; above average compared to previous years.
Cabbage looper: Cabbage looper counts decreased in all areas; below average for this time of season.
Diamondback moth: DBM moth counts decreased in most areas. About average for this time of the year.
Whitefly: Adult movement beginning at low levels, average for early spring.
Thrips: Thrips adult counts reached their peak for the season. Above average compared with previous years.
Aphids: Aphid movement decreased in all areas; below average for late-March.
Leafminers: Adults remain low in most locations, below average for March.