
In a world of increasing costs associated with about everything we do, there is some good news in the international fertilizer market. In response, we can begin to anticipate changes in fertilizer costs at the field level.
International fertilizer prices began to experience sharp increases in 2021 due to a series of supply shocks, weather patterns, fertilizer production plant closures, an imperfectly competitive and shallow market structure, and a series of policy changes that resulted in significant price volatility and a drop in fertilizer affordability. Since then, higher prices of fertilizers have been a challenge globally and it has certainly impacted our crop production systems of the desert Southwest (Figure 1).
Some of the fertilizer and grain trade flow issues we have recently experienced developed in relation to the Russian conflict with Ukraine that began in February 2022 and the resultant tensions in the region. Economic sanctions have been imposed on Russia, inflation has been increasing fertilizer prices and transportation, and other pandemic-related complications have contributed to transportation logistical challenges. But the Russian-Ukrainian conflict has not been the sole cause of the international fertilizer price increases.
Some production and supply reductions experienced in the European, Chinese, and Russian segments of the global fertilizer industry have been caused by sharp increases in production costs. For example, prices of natural gas and ammonia in Europe, Russia, and in China have increased along with high prices for coal which have created reductions in electricity production and consequential disruptions in the fertilizer industry, which is energy intensive. The Chinese reduced fertilizer exports in 2021 because of these reductions in fertilizer production and supply (Figure 2; Raghuveer and Wilczewski, 2022).
Despite the difficulties in the international fertilizer market in the past 18 months, there are some promising recent trends. In the past several months international fertilizer prices have come down to levels close to those experienced in early 2021. Even considering the recent declines in the international fertilizer prices, they are not expected to drop below pre-pandemic levels, primarily due to global inflation that generates an increase in production and transportation costs (Figure 1; Quinn, 2023).
By the end of July 2023, anhydrous ammonia (82-0-0) was 6% lower in late July than a month earlier with an average price of $713/ton. Among the other major fertilizer materials, diammonium phosphate (DAP) had an average price in late July of $807 per ton, monoammonium phosphate (MAP) $812/ton, potash (primarily muriate of potash, KCl) was $608/ton, urea (45-0-0) $596/ton, liquid ammonium polyphosphate (10-34-0) $717/ton, urea ammonium nitrate (UAN28) $385/ton, and a higher N concentration form of UAN32 was $457/ton.
It is important to note that urea ammonium nitrate (UAN) is 28% N in some materials and 32% N in another common form. Also, monoammonium phosphate (MAP) can have N concentrations of 10-12% and P2O5 concentrations of 48-61%, with 11-52-0 being the most common dry form in the market.
On a percentage basis, urea (46-0-0) is 29% less expensive than a year ago, potash fertilizers are now 31% lower, urea ammonium nitrate (UAN32) is 34% less expensive and another form with 28% N (UAN28) is 36% lower, and anhydrous is 50% less expensive compared to last year. Monoammonium phosphate (11-52-0) is now 22% lower and diammonium phosphate (DAP) 18-46-0 and ammonium polyphosphate (10-34-0) are 20% lower in price.
Urea (46-0-0) has recently dropped below the $600/ton to $585/ton for the first time since late September 2021. Anhydrous ammonia (82-0-0) has had an average price recently of $713/ton, which is down about 9% in price from April 2023. Muriate of potash (KCl, 0-0-60) had an average price in the past month of $608/ton, ammonium polyphosphate (10-34-0) average price has been $717/ton, and urea ammonium nitrate (UAN-32, 32-0-0) average price has been $457/ton this past month. Urea ammonium nitrate (UAN-28, 28-0-0) price has dropped to an average of $385/ton.
When considering nitrogen (N) fertilizer prices in terms of the price per pound of N, recent urea (45-0-0) prices averaged $0.65/lb.N, anhydrous ammonia (82-0-0) $0.44/lb.N, urea ammonium nitrate (UAN28) $0.69/lb.N and urea ammonium nitrate with 32%N (UAN32) is now $0.71/lb.N.
Hopefully, the trajectory of fertilizer prices experienced in the past 18 months will continue and the average costs may return to levels close to 2021 (Figure 1). However, international logistics in the fertilizer industry, including shipping, transfer, and distribution of fertilizer cargo continue to be very important in the fertilizer markets and any projections for the future. Market and transportation issues in the Black Sea region and limitations in the exportation of fertilizer materials from the western ports of Canada due to labor issues, primarily affecting potassium fertilizers, are still important factors to watch.
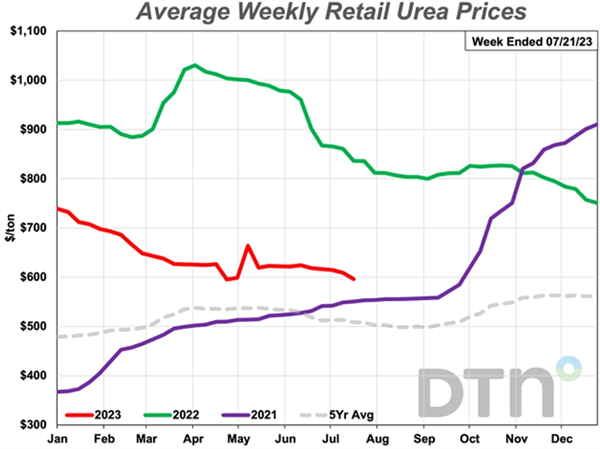
Figure 1. Average weekly retail prices for anhydrous ammonia (82% N), for 2021,
2022, and through 21 July 2023. Source: DTN/Quinn, 2023.
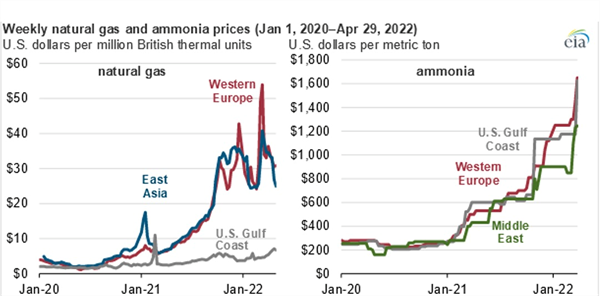
Figure 2. General relationship between weekly natural gas and ammonium
fertilizer prices, 2020-2022. Source: T. Raghuveer and W. Wilczewski. U.S.
Energy Information Administration.
References:
Quinn, R. 2023. DTN Retail Fertilizer Trends: Fertilizer prices moving in two directions. DTN Newsletter, 26 July 2023. https://www.dtnpf.com/agriculture/web/ag/crops/article/2023/07/26/urea-drops-600-per-ton-first-time
T. Raghuveer and W. Wilczewski. 2022. U.S. ammonia prices rise in response to higher international natural gas prices. U.S. Energy Information Administration. https://www.eia.gov/todayinenergy/detail.php?id=52358#
Hi, I’m Chris, and I’m thrilled to be stepping into the role of extension associate for plant pathology through The University of Arizona Cooperative Extension in Yuma County. I recently earned my Ph.D. in plant pathology from Purdue University in Indiana where my research focused on soybean seedling disease caused by Fusarium and Pythium. There, I discovered and characterized some of the first genetic resources available for improving innate host resistance and genetic control to two major pathogens causing this disease in soybean across the Midwest.
I was originally born and raised in Phoenix, so coming back to Arizona and getting the chance to apply my education while helping the community I was shaped by is a dream come true. I have a passion for plant disease research, especially when it comes to exploring how plant-pathogen interactions and genetics can be used to develop practical, empirically based disease control strategies. Let’s face it, fungicide resistance continues to emerge, yesterday’s resistant varieties grow more vulnerable every season, and the battle against plant pathogens in our fields is ongoing. But I firmly believe that when the enemy evolves, so can we.
To that end I am proud to be establishing my research program in Yuma where I will remain dedicated to improving the agricultural community’s disease management options and tackling crop health challenges. I am based out of the Yuma Agricultural Center and will continue to run the plant health diagnostic clinic located there.
Please drop off or send disease samples for diagnosis to:
Yuma Plant Health Clinic
6425 W 8th Street
Yuma, AZ 85364
If you are shipping samples, please remember to include the USDA APHIS permit for moving plant samples.
You can contact me at:
Email: cdetranaltes@arizona.edu
Cell: 602-689-7328
Office: 928-782-5879
Over the last month, we’ve been developing a prototype wide bed steam applicator for injecting steam at shallow depths to kill weed seed prior to planting. The device principally comprises a 65 BHP steam generator mounted on a trailer and an elongated bed shaper (Fig. 1). The apparatus applies steam via shank injection and from ports on top of the bed shaper. The goal is to raise soil temperature to >140 °F for > 20 minutes, levels known to kill weed seed (Baker & Roistacher, 1957). Development is still in progress but results of preliminary tests are encouraging as soil surface temperatures were relatively uniform and exceeded 160 °F (Fig. 2). Experiments with baby leaf spinach crops will be conducted in the next couple of weeks. Stay tuned for trial results and reports on weed control efficacy and labor savings.
References
Baker, K. F., and C. N. Roistacher. 1957. The U.C. system for producing healthy container grown plants. Calif. Agric. Exper. Sta. Ext. Serv. Manual 23.
Acknowledgements
This work funded in part by the Arizona Specialty Crop Block Grant Program. We greatly appreciate their support. Any opinions, findings, conclusions, or recommendations expressed in this publication are those of the author(s) and do not necessarily reflect the view of the USDA or the Arizona Department of Agriculture.
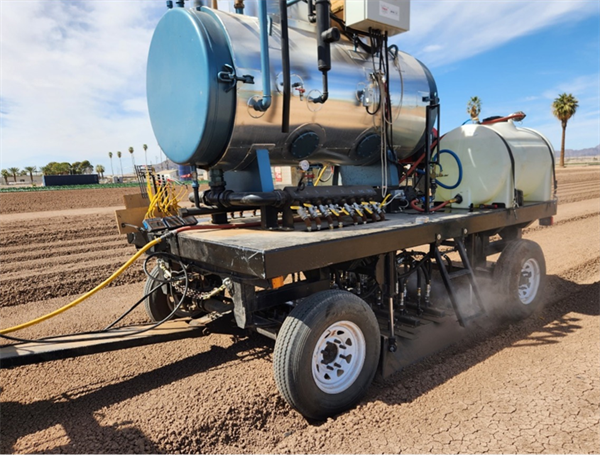
Fig. 1. Wide bed steam applicator principally comprising a 65 BHP steam
generator mounted on a trailer and a bed shaper applicator sled.
Fig. 2. Video of wide bed steam applicator. Soil surface temperature is presented
using an infrared thermometer gun.
The subject of Prefar (bensulide) residue in the soil and waiting period before spinach was was brought to the IPM team in the past. Inadvertently some sections of fields with bensulide residue could be scheduled for planting spinach too soon. The rotational crop instructions on the label say: “All other crops should not be planted for 120 days and the soil must be tilled to a minimum of 4 inches prior to replanting”. The Section VI of the PCA Sudy Guide recommends 4 months recropping interval for Alfalfa, wheat and Cotton.
The site Gowan.com explains specifically: “Do not use Prefar 4-E on spinach or Swiss Chard as severe phytotoxicity will occur”1.
We also heard different opinions, some minimizing the persistence on this herbicide in fine textured soils. So, we tried it in our clay soil at the Yuma Ag Center with a 40% Clay, 38% Sand, and 22% Silt.
After a bensulide lettuce evaluation was completed, we reworked the beds and planted spinach. This was done 45 days after treated.
Here’s how the stand was affected:
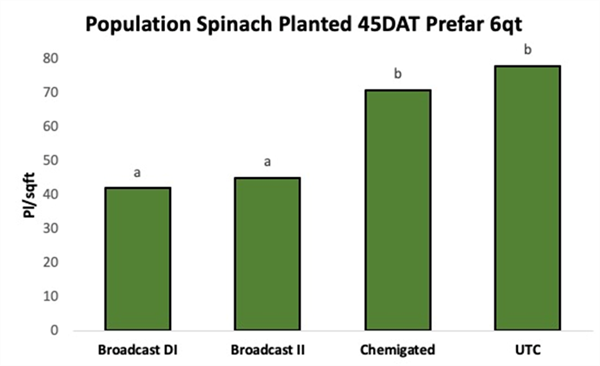
Figure1. Effect of bensulide herbicide residue in spinach stand. Broadcast “DI” means delayed incorporated and “II” Immediately incorporated with sprinkler irrigation.
Additionally, leaves, roots and plant lengths were evaluated showing vigor reduction in treated plots.
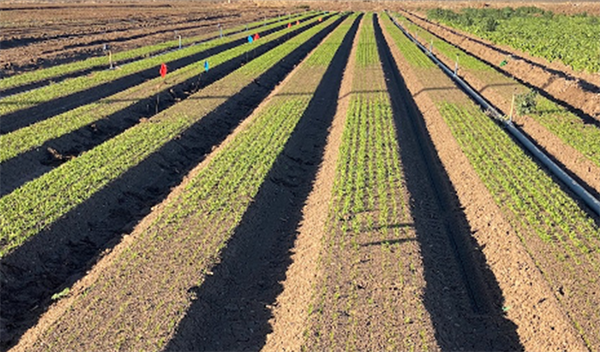
Figure 2. Bensulide effects to spinach stand 45 planted 45DAT.
This time of year, John would often highlight Lepidopteran pests in the field and remind us of the importance of rotating insecticide modes of action. With worm pressure present in local crops, it’s a good time to revisit resistance management practices and ensure we’re protecting the effectiveness of these tools for seasons to come. For detailed guidelines, see Insecticide Resistance Management for Beet Armyworm, Cabbage Looper, and Diamondback Moth in Desert Produce Crops .
VegIPM Update Vol. 16, Num. 20
Oct. 1, 2025
Results of pheromone and sticky trap catches below!!
Corn earworm: CEW moth counts declined across all traps from last collection; average for this time of year.
Beet armyworm: BAW moth increased over the last two weeks; below average for this early produce season.
Cabbage looper: Cabbage looper counts increased in the last two collections; below average for mid-late September.
Diamondback moth: a few DBM moths were caught in the traps; consistent with previous years.
Whitefly: Adult movement decreased in most locations over the last two weeks, about average for this time of year.
Thrips: Thrips adult activity increased over the last two collections, typical for late September.
Aphids: Aphid movement absent so far; anticipate activity to pick up when winds begin blowing from N-NW.
Leafminers: Adult activity increased over the last two weeks, about average for this time of year.


