Irrigation efficiency has been receiving a lot of attention in recent months, particularly with the Colorado River system water shortages that we have been experiencing. There are several ways to define irrigation efficiency. The primary definitions for irrigation efficiency include water conveyance and delivery systems, agronomic, economic, and environmental efficiencies.
Water Conveyance and Delivery System Efficiency
In the desert Southwest we have the benefit of good engineering and infrastructure with the highly developed systems of dams, primary and secondary canals, pumps, laterals, and ditches that move water from rivers and groundwater supplies to areas of need, which are often managed by irrigation districts.
Our ability to move water from the original source to the field is a critical aspect of managing water resources and there is an “efficiency” consideration associated with that. This level of efficiency is largely a function of system engineering design, maintenance, and management.
Economic Efficiency
Economic efficiency is often considered to be the primary factor defining the financial sustainability of a farming operation. Water is a crop input and the costs associated with irrigating a crop include the costs of the water and delivery (pumps, equipment, maintenance, labor, etc.). Water is consistently the most expensive and critical input provided to a crop in Arizona and the desert Southwest. Economic efficiency essentially considers the “return on the investment” and profitability of irrigating a crop.
Environmental Efficiency
Considerations of irrigation efficiency from an environmental perspective is very broad and encompassing and it can include a combination of factors previously discussed (water conveyance systems, agronomic, and economic considerations). Environmental efficiency of an irrigation system is the product of the overall stewardship of water as a natural resource with multiple considerations for beneficial use.
Agronomic Irrigation Efficiency
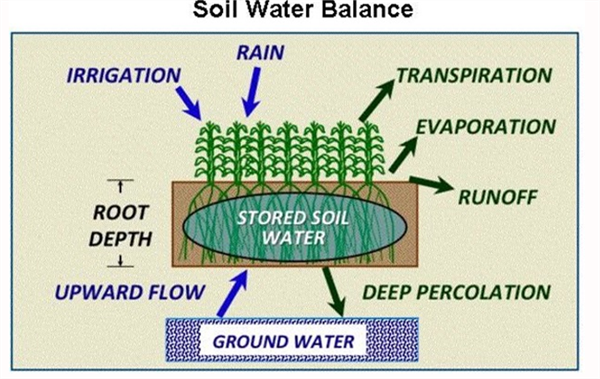
Agronomic (crop and soil) considerations are centered on our ability to provide irrigation water for the sustainable production of a crop in the field. The three primary demands for crop water management include: 1) providing water for seed germination and stand establishment, 2) providing irrigation water to match crop-consumptive water use, and 3) sufficient irrigation water to leach soluble salts from the root zone so that the soils can support crop production in a sustainable manner (Figure 1).
Agronomic efficiency at the field level focuses on the crop water demand (CWD) through crop consumptive use, often referred to as the crop evapotranspiration (ETc), which is the combination of evaporation and transpiration from the crop. Total crop water demand should also include the leaching requirement (LR), which is dependent upon the crop and salinity of the irrigation water.

Agronomic efficiency can be estimated by considering the difference between total crop water demand, CWD and the volume of irrigation water applied (IWA).

The Leaching Requirement (LR) can be estimated by use of the following calculation:

Where:
ECw = salinity of the irrigation water, electrical conductivity (dS/m)
ECe = critical plant salinity tolerance, electrical conductivity (dS/m)
This is a good method of for the LR calculation that has been utilized extensively and successfully in Arizona and the desert Southwest for many years. We can easily determine the salinity of our irrigation waters (ECw) and we can find the critical plant salinity tolerance level from open access tabulations of salinity tolerance for many crops (Ayers and Westcot, 1989). Additional direct references are from Dr. E.V. Maas’ lab at the University of California (Maas, 1984: Maas, 1986; Maas and Grattan, 1999; Maas and Grieve, 1994; and Maas and Hoffman, 1997).
Estimating Field Level Irrigation Efficiencies
The focal point of any irrigation system, from the regional, district, farm, and field levels is to provide water to produce a crop. The crop is the centerpiece of the entire operation. Therefore, it is entirely appropriate to consider irrigation efficiency at the field level in agronomic terms, by use of Equation 2.
We need three factors to estimate agronomic field level irrigation efficiency for a crop: 1) crop evapotranspiration (ETc), 2) the crop and field leaching requirement (LR), and 3) a measure of the irrigation water applied (IWA) to the field in question.
To determine crop evapotranspiration (ETc) we need a good reference evapotranspiration (ETo) measurement for the field site in question. Reference evapotranspiration (ETo) values multiplied by an appropriate crop coefficient (Kc) can provide very good estimates on actual crop evapotranspiration (ETc) rates as shown in the following equation:

Reference Evapotranspiration (ETo)
The Arizona Meteorological Network (AZMET) is a system that provides both historical and real-time weather information that can be used to track reference evapotranspiration (ETo) measured at a standardized and properly calibrated weather station site. Reference evapotranspiration values can be obtained daily from AZMET for the nearly 30 sites in Arizona, including several sites in the Yuma area and the lower Colorado River Valleys.
Very importantly, the AZMET data is of a very high quality and the integrity of the system has been very well managed for over 36 years, first under the direction of Dr. Paul Brown and now with Dr. Jeremy Weiss. This information is valuable in crop water and irrigation management.
Crop Coefficients (Kc)
The appropriate crop coefficient (Kc) values are specific for each crop species and stage of growth. We commonly use crop coefficient (Kc) values that are provided in the publication “Consumptive Use by Major Crops in the Desert Southwest” by Dr. Leonard Erie and his colleagues, USDA-ARS Conservation Research Report No. 29. Crop coefficients from the publication FAO 56 “Crop Evapotranspiration-Guidelines for Computing Crop Water Requirements-FAO Irrigation and Drainage Paper 56” (Allen et al., 1998) are also sometimes used. Reference information for Kc values can be obtained in these publications for common crops grown in this region.
Example: Irrigation Efficiency Calculation
If we consider an example lettuce crop irrigated with water that has ECw = 1.1 dS/m and the total seasonal crop consumptive use (ETc) = 30 inches
Using Equations 1-3, an overall estimate of field level irrigation efficiency can be made. From Equation 2 we can estimate the leaching requirement (LR).

ECw = 1.1 dS/m and ECe (lettuce) = 1.3 dS/m
LR = 1.1 dS/m / (5 X 1.3) – 1.1 = 1.1/5.4 = 0.20 = 20% leaching requirement
LR = 30 X 0.2 = 6.1 ~ 6 inches
Thus, CWD = 30 + 6 = 36 inches total
For this example, we can assume: 40 inches of irrigation water was applied (IWA).
Therefore: Agronomic efficiency (from Equation 1) = 36/40 = 0.9 = 90% efficiency
Note: If the LR were not included in the total CWD, efficiency would be: 30/40 = 75%
That is an important difference and distinction to understand and demonstrate.
Irrigation efficiency has always been a major concern in the agriculture of the desert Southwest, and it always will be. The increased levels of attention being given to irrigation efficiency is good and it is important to recognize there are many factors associated with improvements in irrigation efficiency.

Figure 1. Soil-water balance and plant relationships in a crop production system.
References
Allen, R. G., Pereira, L. S., Raes, D., & Smith, M. (1998). Crop evapotranspiration-Guidelines for computing crop water requirements-FAO Irrigation and drainage paper 56. FAO, Rome, 300(9), D05109.
Ayers, R.S. and D.W. Westcot. 1989 (reprinted 1994). Water quality for agriculture. FAO Irrigation and Drainage Paper 29 Rev. 1. ISBN 92-5-102263-1. Food and Agriculture Organization of the United Nations Rome, 1985 © FAO.
https://www.fao.org/3/t0234e/t0234e00.htm
Erie, L.J., O.A French, D.A. Bucks, and K. Harris. 1981. Consumptive Use of Water by Major Crops in the Southwestern United States. United States Department of Agriculture, Conservation Research Report No. 29.
Maas, E.V. 1984. Crop tolerance to salinity. California Agriculture, October 1984. https://calag.ucanr.edu/archive/?type=pdf&article=ca.v038n10p20
Maas, E.V. 1986. Salt tolerance of plants. Appl. Agric. Res., 1, 12-36.
Maas, E.V. and S.R. Grattan. 1999. Crop yields as affected by salinity, Agricultural Drainage, Agronomy Monograph No. 38.
Maas, E. V., and Grattan, S. R. (1999). Crop yields as affected by salinity, agricultural
drainage, Agronomy Monograph No. 38, R. W.
Maas, E. V., and Grieve, C. M. 1994. “Salt tolerance of plants at different growth stages,” in Proc., Int. Conf. Current Developments in Salinity and Drought Tolerance of Plants. January 7–11, 1990, Tando Jam, Pakistan, 181–197.
Maas, E. V., and Hoffman, G. J. (1977). “Crop salt tolerance: Current assessment.”
This study was conducted at the Yuma Valley Agricultural Center. The soil was a silty clay loam (7-56-37 sand-silt-clay, pH 7.2, O.M. 0.7%). Spinach ‘Meerkat’ was seeded, then sprinkler-irrigated to germinate seed Jan 13, 2025 on beds with 84 in. between bed centers and containing 30 lines of seed per bed. All irrigation water was supplied by sprinkler irrigation. Treatments were replicated four times in a randomized complete block design. Replicate plots consisted of 15 ft lengths of bed separated by 3 ft lengths of nontreated bed. Treatments were applied with a CO2 backpack sprayer that delivered 50 gal/acre at 40 psi to flat-fan nozzles.

Downy mildew (caused by Peronospora farinosa f. sp. spinaciae)was first observed in plots on Mar 5 and final reading was taken on March 6 and March 7, 2025. Spray date for each treatments are listed in excel file with the results.
Disease severity was recorded by determining the percentage of infected leaves present within three 1-ft2areas within each of the four replicate plots per treatment. The number of spinach leaves in a 1-ft2area of bed was approximately 144. The percentage were then changed to 1-10scale, with 1 being 10% infection and 10 being 100% infection.
The data (found in the accompanying Excel file) illustrate the degree of disease reduction obtained by applications of the various tested fungicides. Products that provided most effective control against the disease include Orondis ultra, Zampro, Stargus, Cevya, Eject .Please see table for other treatments with significant disease suppression/control. No phytotoxicity was observed in any of the treatments in this trial.
With the advent of low-cost computing systems that can identify and locating crop and weed plants in real-time, there’s been an explosion in the interest, investment and development of technologies for robotic/automated weed control. A quick internet search will reveal over 50 companies or university research groups working in this space. You are probably familiar with many of these as they are domestically based and have been discussed in previous articles, but there are also numerous efforts being made in Europe that may be of interest. One of these is highlighted here. In future articles, I’ll discuss additional technologies.
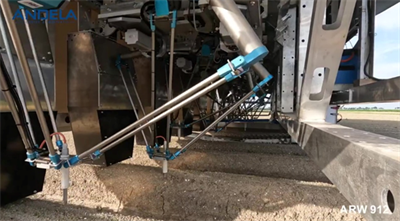
Andela Techniek & Innovatie1 is a Dutch company who appears to be making good progress with an innovative robotic weeding machine (Fig. 1). The solar powered device spans 29.5 feet and is equipped with 12 robotic delta arms for removing in-row weeds (Fig. 2). A camera-based imaging system is used to differentiate crop plants from weeds and provide coordinates of targeted weeds to the delta arms. Each delta arm is equipped with an end-effector that uses heat to kill the weed when it comes into contact with it. A company video showing the device operating in carrot and onion crops can be found by clicking here or on the images below.
Stay tuned!
Fig. 1. Andela Techniek & Innovatie1 solar powered robotic weeding machine. (Photo credits: Andela Techniek & Innovatie)

Fig. 2. Delta arms and end effector of Andela Techiek &
Innovatie1 robotic weeding machine. (Photo credits:
Andela Techniek & Innovatie)
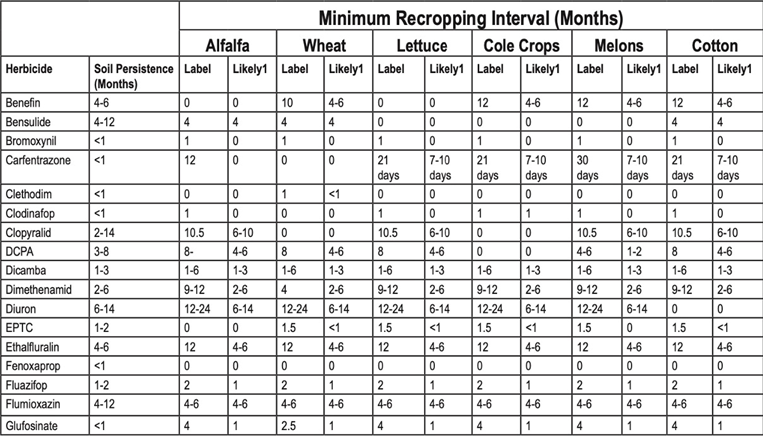
The IPM team has received questions about how to evaluate possible crop injury from herbicides that were applied in previous seasons. As we know residual soil activity is very useful when we needed but we must be very careful when the following crop is sensitive. Potential injury is affected by soil type, watering methods, weather, tillage, organic matter, or the combination of these factors.
The following is a chart that “Minimum Recroping Interval” contains the rotational crop interval and soil persistence of herbicides for the major crops and herbicides used in the desert. You can find this chart in the PCA Study Guide Section VI-26.

During 2014-2018 we ran an HPLC (High Pressure Liquid Chromatograph) in our Lab at the Ag. Center to quantify soil and plant herbicide residues free of charge. Currently we don’t have this equipment available so, we helped growers and PCAs evaluate potential herbicide injury using our greenhouses at the Yuma Ag Center (YAC). A basic bioassay can be done just by growing sensitive plants in pots containing soil from the field in question. Even though bioassays are often done with plants that are sensitive to the herbicide used, it is reasonable to use the crop and variety that will be planted.
Also, it is very important to collect small amounts (top 2-4 inches) from several areas of the field. Herbicide concentrations often changes within fields, so separate samples should be collected and labeled to indicate which block they come from.
We are also doing some field evaluations right now with bensulide and metolachlor in spinach at the UA YAC to answer some of your questions and results will be shared soon in this newsletter. If you have a suggestion or herbicide injury test or bioassay you want to run, please contact us at AZVegIPM-Team@email.arizona.edu.
Results of pheromone and sticky trap catches can be viewed here.
Corn earworm: CEW moth counts down in all traps over the last month; about average for December.
Beet armyworm: Moth trap counts decreased in all areas in the last 2 weeks but appear to remain active in some areas, and average for this time of the year.
Cabbage looper: Moths increased in the past 2 weeks, and average for this time of the season.
Diamondback moth: Adults increased in several locations last, particularly in the Yuma Valley most traps. Below average for December.
Whitefly: Adult movement remains low in all areas, consistent with previous years
Thrips: Thrips adult movement continues to decline, overall activity below average for December.
Aphids: Winged aphids still actively moving but declined movement in the last 2 weeks. About average for December.
Leafminers: Adult activity down in most locations, below average for this time of season.