All plants have distinct habits of growth and development as a function of time (phenology). Plant growth is a direct response to environmental conditions, particularly temperature and in some cases daylength. As a result, tracking plant growth and development as a function if temperature conditions is a much more reliable method than the calendar.
In a recent edition of this newsletter on 4 April 2023, I presented a cantaloupe phenological (crop growth and development) model based on heat units accumulated after planting (HUAP, 86/55 Fo thresholds) as shown in Figure 1.
Phenological models can serve as good tools for improving crop management (e.g., fertilization, irrigation, harvest scheduling, pest management activities, and labor, etc.) by identifying and predicting important stages of crop growth and development and harvest dates.
Included in our work with the development of this phenological model, we have also conducted nutrient uptake and water use studies to develop a better understanding of nutrient and water demand for desert cantaloupe production (Silvertooth, 2003; Soto et al., 2006; and Soto, 2012).
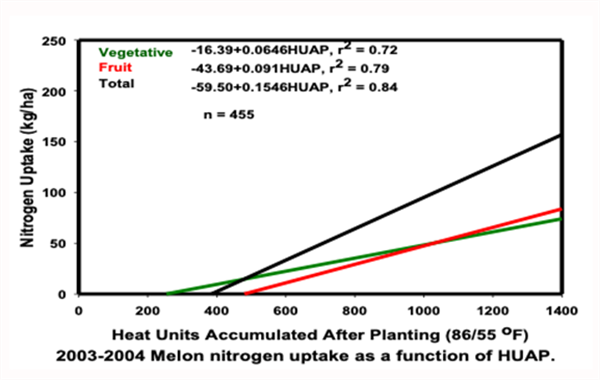
Figure 2 presents the nitrogen (N) uptake and portioning patterns for desert cantaloupes (melons), (Silvertooth, 2003 and Soto et al. 2006). The total N uptake for cantaloupes was found to be approximately 140 lbs. N/acre. The maximum N flux (N uptake/day) period extends from early fruit development (crown stage) to the netting stage.
Water use by desert cantaloupe production was also measured in these studies and patterns of water use followed the crop coefficient (Kc) patterns provided by the Arizona Meteorological Network (AZMET) and conformed to the Kc values from FAO 56 (Allen et al., 1998 and Grattan et al., 1998).
Considering N uptake and water demand patterns in relation to cantaloupe crop phenology, we can insert the overlaps as shown in Figure 1, with the red and blue lines for N and water management, respectively. Maximum N demand occurs from approximately 500 to 1,000 HUAP, which coincides with primary fruit development.
The N application window is recommended in advance of the optimum N uptake period to provide for N mineralization and the plant-available forms of N for plant uptake and utilization.
The N application window for optimum N uptake is from approximately 300 to 800 HUAP, which is from early flowering (crown blooms) to the netting stage of the crown fruit.
Early and split applications during the N application window of cantaloupe crop development can help achieve optimum utilization and higher efficiencies of fertilizer N inputs.
The period of maximum water demand extends from early fruiting stages of development through the maturation of the crown fruit, 300 to 1300 HUAP.
Considering the current water shortages and high prices of fertilizers, we have sufficient motivation to manage our crop production systems with the highest efficiency possible. Understanding crop water and nutrient demand for each crop we are working with and using that knowledge to manage our crops most effectively, is to our benefit agronomically, economically, and environmentally.
Nitrogen is the plant nutrient required in largest amounts by crops and it is important for us to manage N inputs for a crop in a careful and deliberate manner. Water and N interactions are a critical aspect of crop growth, development, and management in any system, but particularly in an irrigated crop production system.
I encourage those who are working with spring cantaloupe production this season to test and evaluate this crop phenology model, particularly in relation to nutrient and water management under field conditions with various planting dates, varieties, and soil types. We appreciate your feedback.
Note: Up to date weather data, including HU accumulations since 1 January can be found for all of the Arizona Meteorological Network (AZMET) locations at the following website: https://ag.arizona.edu/azmet/
References:
Grattan, S.R., W. Bowers, A. Dong, R.L. Snyder, J.J. Carroll, and W. George. 1998. New crop coefficients estimate water use of vegetables, row crops. California Agriculture 52(1):16-21. https://doi.org/10.3733/ca.v052n01p16
Allen, R.G., L.S. Pereira, D. Raes, and M. Smith. 1998. Crop evapotranspiration - Guidelines for computing crop water requirements - FAO Irrigation and drainage paper 56. Food and Agriculture Organization of the United Nations. Rome (FAO). https://www.fao.org/3/x0490e/x0490e0b.htm
Silvertooth, J.C. 2003. Nutrient uptake in irrigated cantaloupes. Annual meeting, ASA-CSSA-SSSA, Denver, CO.
Soto, R. O. 2012. Crop phenology and dry matter accumulation and portioning for irrigated spring cantaloupes in the desert Southwest. Ph.D. Dissertation, Department of Soil, Water and Environmental Science, University of Arizona.
Soto-Ortiz, R., J.C. Silvertooth, and A. Galadima. 2006. Nutrient uptake patterns in irrigated melons (Cucumis melo L.). Annual Meetings, ASA-CSSA-SSSA, Indianpolis, IN.

Figure 1. Heat Units Accumulated After Planting (HUAP,86/55 °F)

Figure 2. Cantaloupe (melon) N uptake and partitioning patterns. (Soto, Silvertooth,
and Galadima 2006). Note: kg/ha * 0.89 = lbs/acre
This study was conducted at the Yuma Valley Agricultural Center. The soil was a silty clay loam (7-56-37 sand-silt-clay, pH 7.2, O.M. 0.7%). Spinach ‘Meerkat’ was seeded, then sprinkler-irrigated to germinate seed Jan 13, 2025 on beds with 84 in. between bed centers and containing 30 lines of seed per bed. All irrigation water was supplied by sprinkler irrigation. Treatments were replicated four times in a randomized complete block design. Replicate plots consisted of 15 ft lengths of bed separated by 3 ft lengths of nontreated bed. Treatments were applied with a CO2 backpack sprayer that delivered 50 gal/acre at 40 psi to flat-fan nozzles.

Downy mildew (caused by Peronospora farinosa f. sp. spinaciae)was first observed in plots on Mar 5 and final reading was taken on March 6 and March 7, 2025. Spray date for each treatments are listed in excel file with the results.
Disease severity was recorded by determining the percentage of infected leaves present within three 1-ft2areas within each of the four replicate plots per treatment. The number of spinach leaves in a 1-ft2area of bed was approximately 144. The percentage were then changed to 1-10scale, with 1 being 10% infection and 10 being 100% infection.
The data (found in the accompanying Excel file) illustrate the degree of disease reduction obtained by applications of the various tested fungicides. Products that provided most effective control against the disease include Orondis ultra, Zampro, Stargus, Cevya, Eject .Please see table for other treatments with significant disease suppression/control. No phytotoxicity was observed in any of the treatments in this trial.
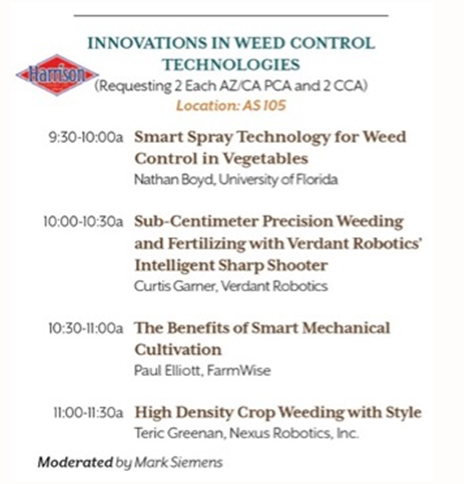
Keeping up to date with the latest developments in automated weeding machines is challenging. It’s a very fast-moving space with significant private and public investment. At the 2023 Southwest Ag Summit “Innovations in Weed Control Technologies” breakout session, university experts and cutting-edge innovators will provide updates on the latest advances in high precision smart spot sprayers, towed automated weeders and autonomous weed pulling robots (agenda below). The session will be held TOMMOROW Thursday, February 23rd from 9:30-11:30 pm at Arizona Western College in Yuma, AZ.
As I mentioned in the last newsletter, we’ll also be demoing our band-steam applicator for controlling soilborne diseases and weeds at the Southwest Ag Summit Field Demo Day (Fig. 2). It is simpler in design and has a higher capacity steam generator as compared to our first prototype. This will increase travel speed and thereby work rate. The event is scheduled for TODAY, Wednesday, February 22nd from 10:00 am – 4:30 pm.
For more information about the Southwest Ag Summit, visit https://yumafreshveg.com/southwest-ag-summit/.
Hope to see you there!

Fig. 1. “Innovations in Weed Control Technologies” breakout session agenda at
the 2023 Southwest Ag Summit. Session will be held Thursday, February 23rd at
Arizona Western College, Yuma, AZ.

Fig. 2. Band-steaming demo plots prior to planting in preparation for the 2023
Southwest Ag Summit Field Demo Day, February
22nd (https://yumafreshveg.com/southwest-ag-summit/).
We published this booklet last July. Please let us know what you think by responding our five questions in the link provided below, email marcop@ag.arizona.edu and let us know if you like to receive a free of the booklet!
The method for identification presented is not by using a dichotomous key or answering complicated questions about the species. The idea is to leaf through the booklet and find images that match plants you see in the field. If there are unusual characteristics, we note them in our comments for each weed. Here is a link to the guide in PDF format: HERE
Results of pheromone and sticky trap catches can be viewed here.
Corn earworm: CEW moth counts down in all traps over the last month; about average for December.
Beet armyworm: Moth trap counts decreased in all areas in the last 2 weeks but appear to remain active in some areas, and average for this time of the year.
Cabbage looper: Moths increased in the past 2 weeks, and average for this time of the season.
Diamondback moth: Adults increased in several locations last, particularly in the Yuma Valley most traps. Below average for December.
Whitefly: Adult movement remains low in all areas, consistent with previous years
Thrips: Thrips adult movement continues to decline, overall activity below average for December.
Aphids: Winged aphids still actively moving but declined movement in the last 2 weeks. About average for December.
Leafminers: Adult activity down in most locations, below average for this time of season.