
It is springtime in the desert and a new spring melon/cantaloupe crop is developing, particularly in the lower Colorado River valleys. Cantaloupes (Cucumis melo ‘reticulatus’ L.) or “melons” are one of the important spring and fall vegetable crops of Arizona and the desert Southwest. Technically, “true” cantaloupes (Cucumis melo ‘cantaloupensis’) are rough, warty fruit, primarily grown in Europe. On a production scale, cantaloupes are not grown commercially in the United States. However, in the United States “cantaloupe” has become a general name of all netted, musk-scented melons (Simonne et al., 1998 and Soto, 2012).
The primary cantaloupe production in the U.S. takes place in four states (Table 1). More than 80% of the U.S. production is in California and Arizona, which is totally irrigated acreage.
|
|
2019 |
2020 |
2021 |
|
Arizona |
14,000 |
11,100 |
9,300 |
|
California |
27,800 |
21,900 |
23,400 |
|
Florida |
2,300 |
1,300 |
1,500 |
|
Georgia |
3,900 |
2,806 |
2,700 |
|
United States (total) |
48,000 |
37,100 |
36,900 |
Table 1. Harvested acreage of major cantaloupe production states, 2019-2021. USDA-National Agricultural Statistics Service. https://www.nass.usda.gov/Statistics_by_State/California/Publications/Crop_Releases/Vegetables/vegean22.pdf
Cantaloupes in the U.S. are generally divided into eastern and western types. The eastern type is characterized by round-shaped fruits, usually about five to seven pounds, sutured (sutures are the green lines that divide the rind into several sections), with variable levels of netting (netting is the network of cork-like marks that cover the rind), and large seed cavities. The western type is characterized by oval-shaped fruits of three to four pounds, sutureless, and a coarsely netted rind (Simonne et al., 1998 and Soto, 2012).
According to the United States Department of Agriculture (USDA) National Agricultural Statistical Services (NASS), the harvested Arizona cantaloupe acreage from 1992 to 2021 has ranged from 9,300 to 23,300 acres with an estimated production value ranging from $38M to $82.5M. Most of the Arizona cantaloupe production takes place in Yuma, Maricopa, and Pinal Counties. Among the nine states with recorded cantaloupe production, Arizona commonly ranks second to California in acres and total production. (USDA, 2021 and Murphree, 2015).
There are several cantaloupe varieties and melon types grown in the desert Southwest. The Hami melon is a type of muskmelon, originally from Hami, Xinjiang, China that has been grown in this region before and has recently been more popular and planted more acres in this region the past few years. In Mandarin Chinese “Hami gua” is a term often used in reference to cantaloupes. These melons are commonly referred to as the “Chinese Hami melon” or the “snow melon”. The outer skin of Hami melons is generally light in color with white, pink, yellow, or green shading. The inside flesh is commonly sweet and crisp.
Being able to accurately describe and predict important stages of crop growth and development (crop phenology) and harvest dates is important for improving melon crop management (e.g. fertilization, irrigation, harvest scheduling, pest management activities, labor and machinery management, etc.). Since plants operate on “thermal time”, they have no regard for calendars or time as we commonly measure it. So, it is best to monitor and predict plant development based on the actual thermal conditions in the plant’s environment. Various forms of temperature measurements and units commonly referred to as heat units (HU), growing degree units (GDU), or growing degree days (GDD) have been utilized in numerous studies to predict phenological events for many crop plants (Baker and Reddy, 2001 and Soto, 2012).
Boswell (1929) first documented the concept of heat summations relative to vegetable crop production in 1929. Thereafter, HU accumulation techniques have been successfully applied to numerous vegetable production systems like cantaloupe (Baker et al., 2001).
The use of HU accumulations has been shown to be an efficient technique for modeling and predicting growth stages in crops (such as cantaloupes) as compared with the traditional days after planting (DAP) method, since variations among seasons and locations can be better normalized using heat units accumulated after planting (HUAP) calculations rather than DAP.
For more than 36 years we have had the benefit of excellent weather data collection in Arizona from the Arizona Meteorological Network (AZMET), which was first developed and directed by Dr. Paul Brown and now Dr. Jeremy Weiss. For warm season crops, such as cantaloupes, we have been working with HUs that have both upper and lower temperature thresholds (86/55 oF), as first described by Baskerville and Emin (1969) and shown in Figure 1 (Brown, 1989). Crop phenology models have been successfully developed using HUs with 86/55 oF thresholds for other common warm season crops in the desert Southwest, such as cotton (Silvertooth, 2001) and New Mexico type chiles (Silvertooth et al., 2010).
Baker et al., (2001) developed a muskmelon phenology model that could be run with easily obtainable weather station data and used by growers to quantify phenological development and aid in projecting harvest dates. The average model accuracy in predicting harvest dates ranged between 1 to 3 days for the data set used to construct the model. Also, after the evaluation of the performance of two GDD models to predict commercial harvest dates in 30 commercial melon fields in California, Hartz (2001) found that the two models were useful in predicting the date of harvest initiation. The standard deviation for the prediction of harvest date from emergence date represented between 2-3 days of normal growing-degree-day accumulation.
Beginning in 2000, we began working to develop and test a phenology model for desert cantaloupe production for Arizona conditions. Following data collection over 10 years with spring cantaloupe fields, primarily in the Yuma area, we were able to develop and test the basic cantaloupe phenology model shown in Figure 2 (Silvertooth, 2003; Soto et al., 2006; and Soto, 2012). This melon crop phenology model was developed under fully irrigated conditions. Guideposts indicated in Figure 2 represent general average or “target” values and a slight degree of variation is normal, similar to some of the earlier models previously mentioned. It is important to note that water or nitrogen stress are two factors that will significantly alter physiological development.
We are currently working to evaluate and update this melon crop model. I encourage those who are working with spring cantaloupe production this season to test and evaluate this crop phenology model in the field under various planting dates, varieties, and conditions. We appreciate your feedback.
References:
Baker, J.T., and V.R. Reddy. 2001. Temperature effects on phenological development and yield of muskmelon. Annals of Botany. 87:605-613.
Baskerville, G.L., and P. Emin. 1969. Rapid estimation of heat accumulation from maximum and minimum temperatures. Ecology 50:514-517.
Boswell, V. R. 1929. Factors influencing yield and quality of peas. Maryland Agric. Exp. Sta. Bull. 306.
Brown, P. W. 1989. Heat units. Ariz. Coop. Ext. Bull. 8915. Univ. of Arizona, Tucson, AZ.
Hartz, T.K. 2001. Development and testing of a growing degree day model to predict melon harvest time. California Melon Research Board. 2001. Annual Report.
Murphree, J. 2015. Fun Statistics about Arizona Agriculture’s Melons and Sweet Corn. Arizona Farm Bureau https://www.azfb.org/Article/FunStatistics-about-Arizona-Agricultures-Melons-and-Sweet-Corn
Silvertooth, J.C. 2001. Following cotton development over the fruiting cycle. University of Arizona Cooperative Extension Bulletin No. AZ 1206.
Silvertooth, J.C. 2003. Nutrient uptake in irrigated cantaloupes. Annual meeting, ASA-CSSA-SSSA, Denver, CO.
Silvertooth, J.C., P.W. Brown, and S. Walker. 2010. Crop Growth and Development for Irrigated Chile (Capsicum annuum). University of Arizona Cooperative Extension Bulletin No. AZ 1529
Simonne, A., E. Simonne, R. Boozer, and J. Pitts. 1998. A matter of taste: Consumer preferences studies identify favorite small melon varieties. Highlights of Agricultural Research. 45(2):7-9.
Soto, R. O. 2012. Crop phenology and dry matter accumulation and portioning for irrigated spring cantaloupes in the desert Southwest. Ph.D. Dissertation, Department of Soil, Water and Environmental Science, University of Arizona.
Soto-Ortiz, R., J.C. Silvertooth, and A. Galadima. 2006. Nutrient uptake patterns in irrigated melons (Cucumis melo L.). Annual Meetings, ASA-CSSA-SSSA, Indianpolis, IN.
USDA Stats: 2021 State of Agriculture Overview.
https://www.nass.usda.gov/Quick_Stats/Ag_Overview/stateOverview.php?state=ARIZONA
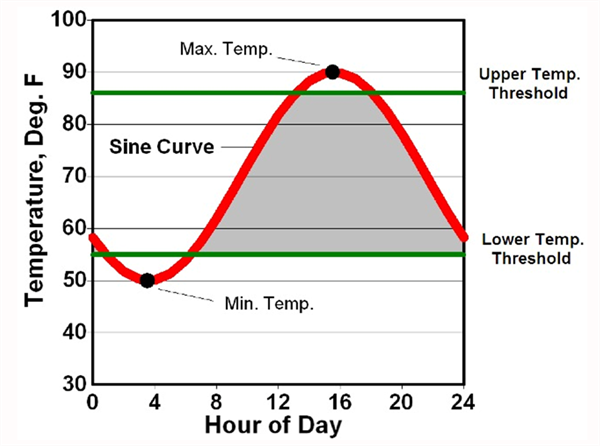
Figure 1. Graphical depiction of heat unit computation using the single sine
curve procedure. A sine curve is fit through the daily maximum and minimum
temperatures to recreate the daily temperature cycle. The upper and lower
temperature thresholds for growth and development are then superimposed
on the figure. Mathematical integration is then used to measure the area
bounded by the sine cure and the two temperature thresholds (grey area). (Brown, 1989)

Figure 2. Heat Units Accumulated After Planting (HUAP, 86/55 oF)
This study was conducted at the Yuma Valley Agricultural Center. The soil was a silty clay loam (7-56-37 sand-silt-clay, pH 7.2, O.M. 0.7%). Spinach ‘Meerkat’ was seeded, then sprinkler-irrigated to germinate seed Jan 13, 2025 on beds with 84 in. between bed centers and containing 30 lines of seed per bed. All irrigation water was supplied by sprinkler irrigation. Treatments were replicated four times in a randomized complete block design. Replicate plots consisted of 15 ft lengths of bed separated by 3 ft lengths of nontreated bed. Treatments were applied with a CO2 backpack sprayer that delivered 50 gal/acre at 40 psi to flat-fan nozzles.

Downy mildew (caused by Peronospora farinosa f. sp. spinaciae)was first observed in plots on Mar 5 and final reading was taken on March 6 and March 7, 2025. Spray date for each treatments are listed in excel file with the results.
Disease severity was recorded by determining the percentage of infected leaves present within three 1-ft2areas within each of the four replicate plots per treatment. The number of spinach leaves in a 1-ft2area of bed was approximately 144. The percentage were then changed to 1-10scale, with 1 being 10% infection and 10 being 100% infection.
The data (found in the accompanying Excel file) illustrate the degree of disease reduction obtained by applications of the various tested fungicides. Products that provided most effective control against the disease include Orondis ultra, Zampro, Stargus, Cevya, Eject .Please see table for other treatments with significant disease suppression/control. No phytotoxicity was observed in any of the treatments in this trial.
Over the last couple of years, we have been investigating the use of band-steam to control weeds and soilborne pathogens. The technique has been discussed in previous mechanization UA Veg IPM articles (link). Briefly, the concept behind band-steam is to disinfest narrow bands of soil centered on the seedline using high temperature steam prior to planting. After the soil cools (<1 day), the crop is planted into the disinfested band (Fig. 1). Weed emergence and disease inoculum is reduced in the seedline. Weeds outside the seedline can be easily removed through cultivation.
Trials results have been impressive, particularly for in-row weed control (Fig. 2). We’ll be demonstrating our 2ndgeneration prototype band-steam applicator and sharing study results at the 2023 Southwest Ag Summit Field Demo, February 22nd (Fig. 3) We’ll also discuss and like to get your input on a new project – development and evaluation of a commercial scale band-steam applicator. The goal of the project is to build a self-propelled steam applicator and evaluate the viability of band steaming at the commercial field scale level. We’re in the preliminary design process now; a concept sketch is shown in Fig. 4. We’d love to get your input/feedback at this stage of the process. Please feel free to reach out to me anytime.
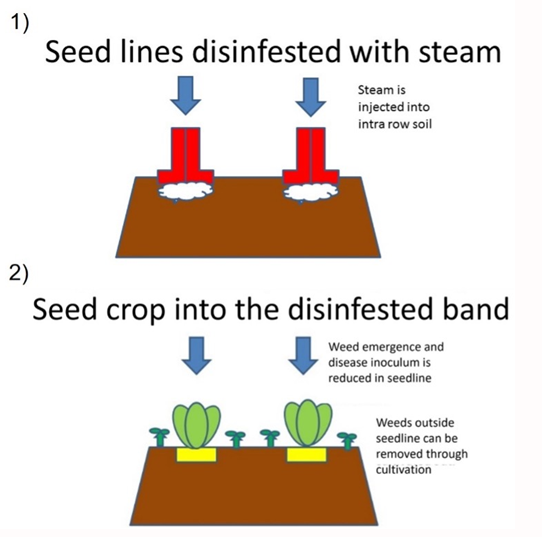
Fig. 1. Treatment sequence: 1) steam is injected into soil where seedline will be
located, then 2) later the crop is planted in the steamed seedline.
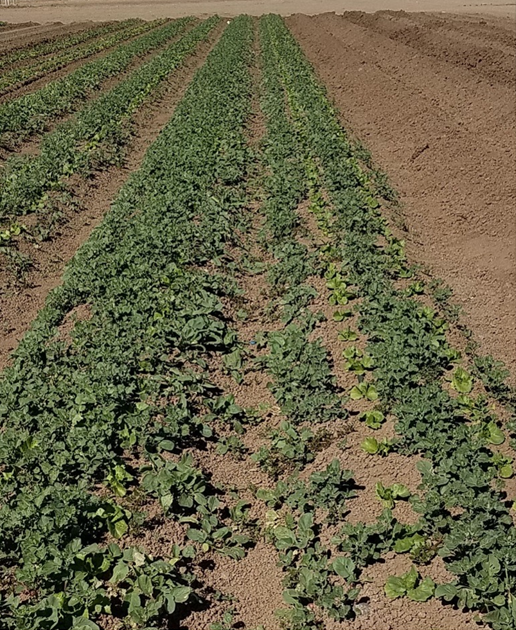
Fig. 2. Weed control in lettuce seedlines of beds treated with band-steam (right)
and untreated (left).
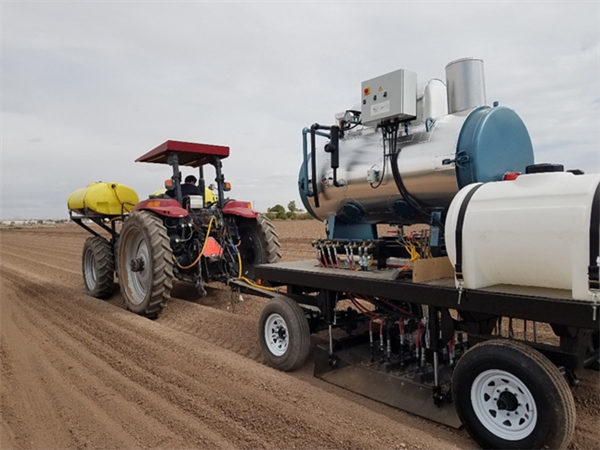
Fig. 3. 2nd generation band steam applicator to be demoed at the 2023 Southwest
Ag Summit Field Demo held February 22rd, 2023 in Yuma, AZ
(https://yumafreshveg.com/southwest-ag-summit/).
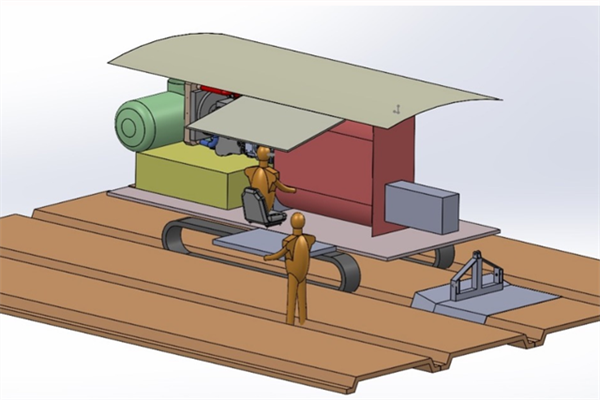
Fig. 4. Concept drawing of a proposed commercial style steam applicator. The
unit has a propane fueled engine and steam generator. The steam injection occurs
at the back of the machine. Water is carried in tanks below the engine, and rubber
tracks are proposed to disperse the weight and avoid soil compaction.
We published this booklet last July. Please let us know what you think by responding our five questions in the link provided below. The first 25 respondents WILL RECEIVE a copy of the guide. Additionally…first five to take the survey and ID the weeds in the cover of the booklet will also get a Navy Blue UA Vegetable IPM HAT.
There are abundant resources for weed identification of mature plants. These include very complete guides such as “Weeds of California and Other Western States” by Joseph DiTomaso published by University of California. “An Illustrated Guide to Arizona Weeds” by Kittie F. Parker with excellent drawings by Lucretia Breazeale Hamilton. There are also several phone apps for weed identification. However, the cotyledons of weeds frequently have a different shape than the true leaves, which makes identification of seedlings difficult for some species. The purpose of this pocket booklet is to provide a quick reference with good images that can be carried in your truck to help you identify the most common broadleaved weeds in Southwestern and Central Arizona.
The method for identification presented is not by using a dichotomous key or answering complicated questions about the species. The idea is to leaf through the booklet and find images that match plants you see in the field. If there are unusual characteristics, we note them in our comments for each weed. Here is a link to the guide in PDF format: HERE
Results of pheromone and sticky trap catches can be viewed here.
Corn earworm: CEW moth counts down in all traps over the last month; about average for December.
Beet armyworm: Moth trap counts decreased in all areas in the last 2 weeks but appear to remain active in some areas, and average for this time of the year.
Cabbage looper: Moths increased in the past 2 weeks, and average for this time of the season.
Diamondback moth: Adults increased in several locations last, particularly in the Yuma Valley most traps. Below average for December.
Whitefly: Adult movement remains low in all areas, consistent with previous years
Thrips: Thrips adult movement continues to decline, overall activity below average for December.
Aphids: Winged aphids still actively moving but declined movement in the last 2 weeks. About average for December.
Leafminers: Adult activity down in most locations, below average for this time of season.