All plants have distinct habits of growth and development as a function of time (phenology). Plant growth is a direct response to environmental conditions, particularly temperature and in some cases daylength. As a result, tracking plant growth and development as a function if temperature conditions is a much more reliable method than the calendar.
In a recent edition of this newsletter on 4 April 2023, I presented a cantaloupe phenological (crop growth and development) model based on heat units accumulated after planting (HUAP, 86/55 Fo thresholds) as shown in Figure 1.
Phenological models can serve as good tools for improving crop management (e.g., fertilization, irrigation, harvest scheduling, pest management activities, and labor, etc.) by identifying and predicting important stages of crop growth and development and harvest dates.
Included in our work with the development of this phenological model, we have also conducted nutrient uptake and water use studies to develop a better understanding of nutrient and water demand for desert cantaloupe production (Silvertooth, 2003; Soto et al., 2006; and Soto, 2012).
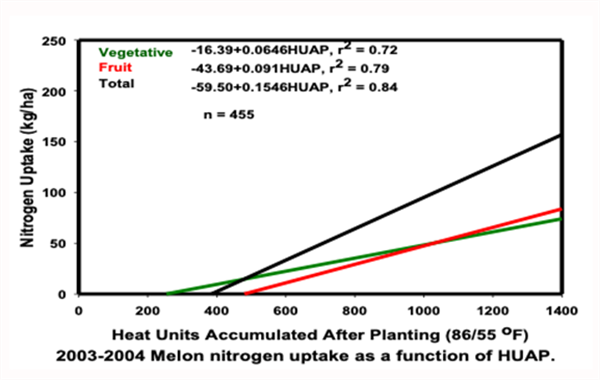
Figure 2 presents the nitrogen (N) uptake and portioning patterns for desert cantaloupes (melons), (Silvertooth, 2003 and Soto et al. 2006). The total N uptake for cantaloupes was found to be approximately 140 lbs. N/acre. The maximum N flux (N uptake/day) period extends from early fruit development (crown stage) to the netting stage.
Water use by desert cantaloupe production was also measured in these studies and patterns of water use followed the crop coefficient (Kc) patterns provided by the Arizona Meteorological Network (AZMET) and conformed to the Kc values from FAO 56 (Allen et al., 1998 and Grattan et al., 1998).
Considering N uptake and water demand patterns in relation to cantaloupe crop phenology, we can insert the overlaps as shown in Figure 1, with the red and blue lines for N and water management, respectively. Maximum N demand occurs from approximately 500 to 1,000 HUAP, which coincides with primary fruit development.
The N application window is recommended in advance of the optimum N uptake period to provide for N mineralization and the plant-available forms of N for plant uptake and utilization.
The N application window for optimum N uptake is from approximately 300 to 800 HUAP, which is from early flowering (crown blooms) to the netting stage of the crown fruit.
Early and split applications during the N application window of cantaloupe crop development can help achieve optimum utilization and higher efficiencies of fertilizer N inputs.
The period of maximum water demand extends from early fruiting stages of development through the maturation of the crown fruit, 300 to 1300 HUAP.
Considering the current water shortages and high prices of fertilizers, we have sufficient motivation to manage our crop production systems with the highest efficiency possible. Understanding crop water and nutrient demand for each crop we are working with and using that knowledge to manage our crops most effectively, is to our benefit agronomically, economically, and environmentally.
Nitrogen is the plant nutrient required in largest amounts by crops and it is important for us to manage N inputs for a crop in a careful and deliberate manner. Water and N interactions are a critical aspect of crop growth, development, and management in any system, but particularly in an irrigated crop production system.
I encourage those who are working with spring cantaloupe production this season to test and evaluate this crop phenology model, particularly in relation to nutrient and water management under field conditions with various planting dates, varieties, and soil types. We appreciate your feedback.
Note: Up to date weather data, including HU accumulations since 1 January can be found for all of the Arizona Meteorological Network (AZMET) locations at the following website: https://ag.arizona.edu/azmet/
References:
Grattan, S.R., W. Bowers, A. Dong, R.L. Snyder, J.J. Carroll, and W. George. 1998. New crop coefficients estimate water use of vegetables, row crops. California Agriculture 52(1):16-21. https://doi.org/10.3733/ca.v052n01p16
Allen, R.G., L.S. Pereira, D. Raes, and M. Smith. 1998. Crop evapotranspiration - Guidelines for computing crop water requirements - FAO Irrigation and drainage paper 56. Food and Agriculture Organization of the United Nations. Rome (FAO). https://www.fao.org/3/x0490e/x0490e0b.htm
Silvertooth, J.C. 2003. Nutrient uptake in irrigated cantaloupes. Annual meeting, ASA-CSSA-SSSA, Denver, CO.
Soto, R. O. 2012. Crop phenology and dry matter accumulation and portioning for irrigated spring cantaloupes in the desert Southwest. Ph.D. Dissertation, Department of Soil, Water and Environmental Science, University of Arizona.
Soto-Ortiz, R., J.C. Silvertooth, and A. Galadima. 2006. Nutrient uptake patterns in irrigated melons (Cucumis melo L.). Annual Meetings, ASA-CSSA-SSSA, Indianpolis, IN.

Figure 1. Heat Units Accumulated After Planting (HUAP,86/55 °F)

Figure 2. Cantaloupe (melon) N uptake and partitioning patterns. (Soto, Silvertooth,
and Galadima 2006). Note: kg/ha * 0.89 = lbs/acre
Frost and freeze damage affect countless fruit and vegetable growers leading to yield losses and occasionally the loss of the entire crop. Frost damage occurs when the temperature briefly dips below freezing (32°F).With a frost, the water within plant tissue may or may not actually freeze, depending on other conditions. A frost becomes a freeze event when ice forms within and between the cell walls of plant tissue. When this occurs, water expands and can burst cell walls. Symptoms of frost damage on vegetables include brown or blackening of plant tissues, dropping of leaves and flowers, translucent limp leaves, and cracking of the fruit. Symptoms are usually vegetable specific and vary depending on the hardiness of the crop and lowest temperature reached. A lot of times frost injury is followed by secondary infection by bacteria or opportunist fungi confusing with plant disease.
Most susceptible to frost and freezing injury: Asparagus, snap beans, Cucumbers, eggplant, lemons, lettuce, limes, okra, peppers, sweet potato
Moderately susceptible to frost and freezing injury: Broccoli, Carrots, Cauliflower, Celery, Grapefruit, Grapes, Oranges, Parsley, Radish, Spinach, Squash
Least susceptible to frost and freezing injury: Brussels sprouts, Cabbage, Dates, Kale, Kohlrabi, Parsnips, Turnips, Beets
More information:
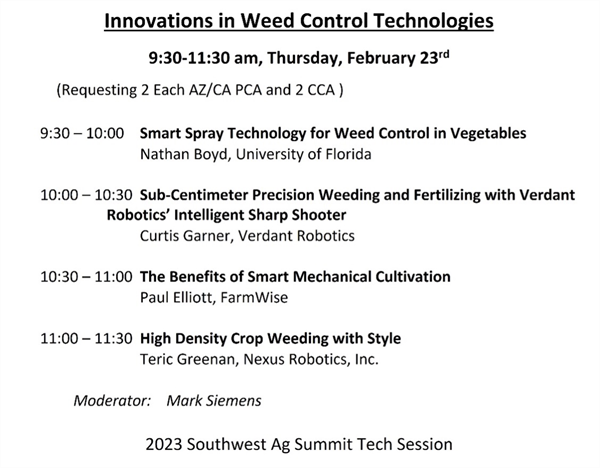
Interested in the latest developments in automated weeding machines? There are a couple of opportunities at the upcoming 2023 Southwest Ag Summit to stay up to date. The first is the “Innovations in Weed Control Technologies” breakout session where university experts and cutting-edge innovators will provide updates on the latest advances in high precision smart spot sprayers, autonomous ag robots and towed automated weeders (agenda below). The session will be held Thursday, February 23rd from 9:30-11:30 am at Arizona Western College (AWC) in Yuma, AZ. The other is the Southwest Ag Summit Field Demo on February 22nd, where several of these technologies and other state-of-the-art automated weeders will be demonstrated operating in the field. The Field Demos will also be held at AWC and begin at 10:30 am.
For more information about the Southwest Ag Summit, visit https://yumafreshveg.com/southwest-ag-summit/. Please note that at the time of this writing, the website has some incorrect dates and programming information. It will be updated soon, so please check back for accurate information. The flyer below has the correct dates (Fig. 2).

Fig. 1. Agenda for the “Innovations in Weed Control Technologies” educational
session at the 2023 Southwest Ag Summit. Session will be held Thursday,
February 23th at Arizona Western College, Yuma, AZ.

Fig. 2. 2023 Southwest Ag Summit flyer. Event will be held at Arizona
Western College in Yuma, AZ.
Results of pheromone and sticky trap catches can be viewed here.
Corn earworm: CEW moth counts remain at low levels in all areas, well below average for this time of year.
Beet armyworm: Trap increased areawide; above average compared to previous years.
Cabbage looper: Cabbage looper counts decreased in all areas; below average for this time of season.
Diamondback moth: DBM moth counts decreased in most areas. About average for this time of the year.
Whitefly: Adult movement beginning at low levels, average for early spring.
Thrips: Thrips adult counts reached their peak for the season. Above average compared with previous years.
Aphids: Aphid movement decreased in all areas; below average for late-March.
Leafminers: Adults remain low in most locations, below average for March.