It is springtime in the desert and a new spring melon/cantaloupe crop is developing, particularly in the lower Colorado River valleys. Cantaloupes (Cucumis melo ‘reticulatus’ L.) or “melons” are one of the important spring and fall vegetable crops of Arizona and the desert Southwest. Technically, “true” cantaloupes (Cucumis melo ‘cantaloupensis’) are rough, warty fruit, primarily grown in Europe. On a production scale, cantaloupes are not grown commercially in the United States. However, in the United States “cantaloupe” has become a general name of all netted, musk-scented melons (Simonne et al., 1998 and Soto, 2012).
The primary cantaloupe production in the U.S. takes place in four states (Table 1). More than 80% of the U.S. production is in California and Arizona, which is totally irrigated acreage.
|
|
2019 |
2020 |
2021 |
|
Arizona |
14,000 |
11,100 |
9,300 |
|
California |
27,800 |
21,900 |
23,400 |
|
Florida |
2,300 |
1,300 |
1,500 |
|
Georgia |
3,900 |
2,806 |
2,700 |
|
United States (total) |
48,000 |
37,100 |
36,900 |
Table 1. Harvested acreage of major cantaloupe production states, 2019-2021. USDA-National Agricultural Statistics Service. https://www.nass.usda.gov/Statistics_by_State/California/Publications/Crop_Releases/Vegetables/vegean22.pdf
Cantaloupes in the U.S. are generally divided into eastern and western types. The eastern type is characterized by round-shaped fruits, usually about five to seven pounds, sutured (sutures are the green lines that divide the rind into several sections), with variable levels of netting (netting is the network of cork-like marks that cover the rind), and large seed cavities. The western type is characterized by oval-shaped fruits of three to four pounds, sutureless, and a coarsely netted rind (Simonne et al., 1998 and Soto, 2012).
According to the United States Department of Agriculture (USDA) National Agricultural Statistical Services (NASS), the harvested Arizona cantaloupe acreage from 1992 to 2021 has ranged from 9,300 to 23,300 acres with an estimated production value ranging from $38M to $82.5M. Most of the Arizona cantaloupe production takes place in Yuma, Maricopa, and Pinal Counties. Among the nine states with recorded cantaloupe production, Arizona commonly ranks second to California in acres and total production. (USDA, 2021 and Murphree, 2015).
There are several cantaloupe varieties and melon types grown in the desert Southwest. The Hami melon is a type of muskmelon, originally from Hami, Xinjiang, China that has been grown in this region before and has recently been more popular and planted more acres in this region the past few years. In Mandarin Chinese “Hami gua” is a term often used in reference to cantaloupes. These melons are commonly referred to as the “Chinese Hami melon” or the “snow melon”. The outer skin of Hami melons is generally light in color with white, pink, yellow, or green shading. The inside flesh is commonly sweet and crisp.
Being able to accurately describe and predict important stages of crop growth and development (crop phenology) and harvest dates is important for improving melon crop management (e.g. fertilization, irrigation, harvest scheduling, pest management activities, labor and machinery management, etc.). Since plants operate on “thermal time”, they have no regard for calendars or time as we commonly measure it. So, it is best to monitor and predict plant development based on the actual thermal conditions in the plant’s environment. Various forms of temperature measurements and units commonly referred to as heat units (HU), growing degree units (GDU), or growing degree days (GDD) have been utilized in numerous studies to predict phenological events for many crop plants (Baker and Reddy, 2001 and Soto, 2012).
Boswell (1929) first documented the concept of heat summations relative to vegetable crop production in 1929. Thereafter, HU accumulation techniques have been successfully applied to numerous vegetable production systems like cantaloupe (Baker et al., 2001).
The use of HU accumulations has been shown to be an efficient technique for modeling and predicting growth stages in crops (such as cantaloupes) as compared with the traditional days after planting (DAP) method, since variations among seasons and locations can be better normalized using heat units accumulated after planting (HUAP) calculations rather than DAP.
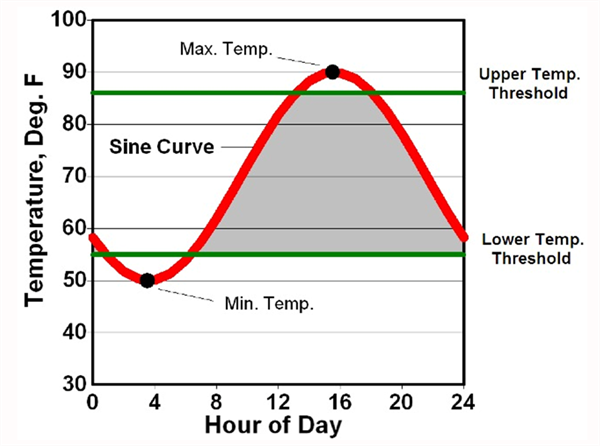
For more than 36 years we have had the benefit of excellent weather data collection in Arizona from the Arizona Meteorological Network (AZMET), which was first developed and directed by Dr. Paul Brown and now Dr. Jeremy Weiss. For warm season crops, such as cantaloupes, we have been working with HUs that have both upper and lower temperature thresholds (86/55 oF), as first described by Baskerville and Emin (1969) and shown in Figure 1 (Brown, 1989). Crop phenology models have been successfully developed using HUs with 86/55 oF thresholds for other common warm season crops in the desert Southwest, such as cotton (Silvertooth, 2001) and New Mexico type chiles (Silvertooth et al., 2010).
Baker et al., (2001) developed a muskmelon phenology model that could be run with easily obtainable weather station data and used by growers to quantify phenological development and aid in projecting harvest dates. The average model accuracy in predicting harvest dates ranged between 1 to 3 days for the data set used to construct the model. Also, after the evaluation of the performance of two GDD models to predict commercial harvest dates in 30 commercial melon fields in California, Hartz (2001) found that the two models were useful in predicting the date of harvest initiation. The standard deviation for the prediction of harvest date from emergence date represented between 2-3 days of normal growing-degree-day accumulation.
Beginning in 2000, we began working to develop and test a phenology model for desert cantaloupe production for Arizona conditions. Following data collection over 10 years with spring cantaloupe fields, primarily in the Yuma area, we were able to develop and test the basic cantaloupe phenology model shown in Figure 2 (Silvertooth, 2003; Soto et al., 2006; and Soto, 2012). This melon crop phenology model was developed under fully irrigated conditions. Guideposts indicated in Figure 2 represent general average or “target” values and a slight degree of variation is normal, similar to some of the earlier models previously mentioned. It is important to note that water or nitrogen stress are two factors that will significantly alter physiological development.
We are currently working to evaluate and update this melon crop model. I encourage those who are working with spring cantaloupe production this season to test and evaluate this crop phenology model in the field under various planting dates, varieties, and conditions. We appreciate your feedback.
References:
Baker, J.T., and V.R. Reddy. 2001. Temperature effects on phenological development and yield of muskmelon. Annals of Botany. 87:605-613.
Baskerville, G.L., and P. Emin. 1969. Rapid estimation of heat accumulation from maximum and minimum temperatures. Ecology 50:514-517.
Boswell, V. R. 1929. Factors influencing yield and quality of peas. Maryland Agric. Exp. Sta. Bull. 306.
Brown, P. W. 1989. Heat units. Ariz. Coop. Ext. Bull. 8915. Univ. of Arizona, Tucson, AZ.
Hartz, T.K. 2001. Development and testing of a growing degree day model to predict melon harvest time. California Melon Research Board. 2001. Annual Report.
Murphree, J. 2015. Fun Statistics about Arizona Agriculture’s Melons and Sweet Corn. Arizona Farm Bureau https://www.azfb.org/Article/FunStatistics-about-Arizona-Agricultures-Melons-and-Sweet-Corn
Silvertooth, J.C. 2001. Following cotton development over the fruiting cycle. University of Arizona Cooperative Extension Bulletin No. AZ 1206.
Silvertooth, J.C. 2003. Nutrient uptake in irrigated cantaloupes. Annual meeting, ASA-CSSA-SSSA, Denver, CO.
Silvertooth, J.C., P.W. Brown, and S. Walker. 2010. Crop Growth and Development for Irrigated Chile (Capsicum annuum). University of Arizona Cooperative Extension Bulletin No. AZ 1529
Simonne, A., E. Simonne, R. Boozer, and J. Pitts. 1998. A matter of taste: Consumer preferences studies identify favorite small melon varieties. Highlights of Agricultural Research. 45(2):7-9.
Soto, R. O. 2012. Crop phenology and dry matter accumulation and portioning for irrigated spring cantaloupes in the desert Southwest. Ph.D. Dissertation, Department of Soil, Water and Environmental Science, University of Arizona.
Soto-Ortiz, R., J.C. Silvertooth, and A. Galadima. 2006. Nutrient uptake patterns in irrigated melons (Cucumis melo L.). Annual Meetings, ASA-CSSA-SSSA, Indianpolis, IN.
USDA Stats: 2021 State of Agriculture Overview.
https://www.nass.usda.gov/Quick_Stats/Ag_Overview/stateOverview.php?state=ARIZONA

Figure 1. Graphical depiction of heat unit computation using the single sine
curve procedure. A sine curve is fit through the daily maximum and minimum
temperatures to recreate the daily temperature cycle. The upper and lower
temperature thresholds for growth and development are then superimposed
on the figure. Mathematical integration is then used to measure the area
bounded by the sine cure and the two temperature thresholds (grey area). (Brown, 1989)

Figure 2. Heat Units Accumulated After Planting (HUAP, 86/55 oF)
I hope you are frolicking in the fields of wildflowers picking the prettiest bugs.
I was scheduled to interview for plant pathologist position at Yuma on October 18, 2019. Few weeks before that date, I emailed Dr. Palumbo asking about the agriculture system in Yuma and what will be expected of me. He sent me every information that one can think of, which at the time I thought oh how nice!
When I started the position here and saw how much he does and how much busy he stays, I was eternally grateful of the time he took to provide me all the information, especially to someone he did not know at all.
Fast forward to first month at my job someone told me that the community wants me to be the Palumbo of Plant Pathology and I remember thinking what a big thing to ask..
He was my next-door mentor, and I would stop by with questions all the time especially after passing of my predecessor Dr. Matheron. Dr. Palumbo was always there to answer any question, gave me that little boost I needed, a little courage to write that email I needed to write, a rigid answer to stand my ground if needed. And not to mention the plant diagnosis. When the submitted samples did not look like a pathogen, taking samples to his office where he would look for insects with his little handheld lenses was one of my favorite times.
I also got to work with him in couple of projects, and he would tell me “call me John”. Uhh no, that was never going to happen.. until my last interaction with him, I would fluster when I talked to him, I would get nervous to have one of my idols listening to ME? Most times, I would forget what I was going to ask but at the same time be incredibly flabbergasted by the fact that I get to work next to this legend of a man, and get his opinions about pest management. Though I really did not like giving talks after him, as honestly, I would have nothing to offer after he has talked. Every time he waved at me in a meeting, I would blush and keep smiling for minutes, and I always knew I will forever be a fangirl..
Until we meet again.
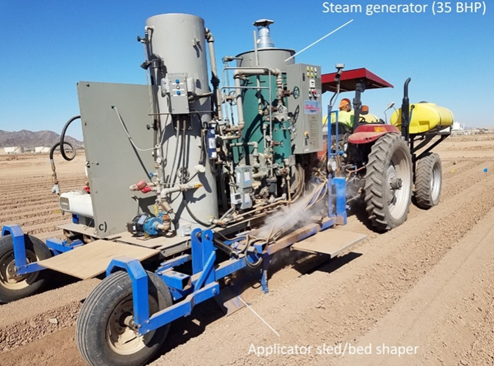
Last month, we investigated the use of applying steam to the soil to control weeds in baby leaf spinach. In the study, we utilized the prototype steam applicator described in previous UA Veg IPM articles to inject steam into the soil prior to planting. The concept is to heat the soil to levels sufficient to kill soilborne pathogens and weed seeds (140 °F > 20 minutes). The device is principally comprised of a 35 BHP steam generator mounted on an elongated bed shaper (Fig. 1). The apparatus applies steam via shank injection and from cone shaped ports on top of the bed shaper. After cooling (<1 day), the crop is planted into the disinfested soil.
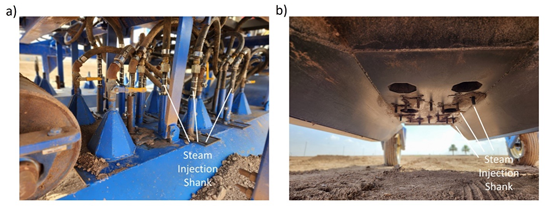
In the trial, the unit was configured so that one of the unit’s narrow-bed bed shapers (42” wide) was outfitted with fourteen steam injection shanks positioned to inject steam in the soil at a depth of about 2” (Fig. 2). Seven of the injectors were in a rank towards the front of the bed shaper with each injector spaced about 3.5” apart. A second rank of 7 injectors, also spaced 3.5” apart, was positioned in-line with the first rank towards the rear of the bed shaper. The steam applicator was underpowered to treat the entire 22” wide bedtop as the machine was designed to treat two, 4” wide bands of soil (8” total). As a consequence, travel speed was slow, 0.15 mph, to ensure target temperatures were met.
Results showed that steam treatment provided outstanding weed control of nearly 100% (Table 1, Fig. 3). The predominant species at the site were nettleleaf goosefoot and common purslane. This is a very impressive result however work rates were low (0.05 ac/hr) and fuel use/cost was high ($1,000/ac).
This was our first trial investigating the use of soil applied steam to control weeds in high density crops and think these operational parameters can be significantly improved. As stated previously, the unit was equipped with a steam generator with insufficient steam generation capacity. Equipping the device with a higher powered steam generator so that two beds can be treated at the same time would double the work rate. Also, steam was injected at a depth of 2” and at a travel speed was such that the amount of steam applied was adequate to control essentially all (100%) of the weeds. It is logical that shallower treatment depths and faster travel speeds could be utilized and still provide adequate control. Finally, it is estimated that travel speed can be at least doubled by operating the device when initial soil temperatures are high (>120 °F) as compared to this study where soil temperatures were relatively low (90 °F) since much less heat energy is needed to raise soil temperatures to target levels. If travel speed were doubled and two beds were treated during a pass, work rate would be improved to 0.21 ac/hr and fuel costs would be about $500/ac. These numbers are much more reasonable and show potential if high levels of weed control can be maintained. Over the next couple of months and throughout the summer, we plan to investigate these and other ways to improve the efficiency of steam application.
Acknowledgements
This work is supported by the Arizona Specialty Crop Block Grant Program and the Crop Production and Pest Management grant no. 2021-70006-35761 /project accession no. 1027435 from USDA-NIFA. We appreciate their support. Any opinions, findings, conclusions, or recommendations expressed in this publication are those of the author(s) and do not necessarily reflect the view of the U.S. Department of Agriculture.

Fig. 1. Band-steam applicator principally comprising a 35 BHP steam generator mounted on a bed-shaper applicator sled.

Fig. 2. Steam applicator sled a) top view and b) bottom view.
|
Table 1. Weed density and control with steam in baby leaf spinach trial. |
||
|
Treatment |
Weed Density |
Weed Control |
|
|
(#/ft2) |
(%) |
|
Steam |
0.05 |
99.4 |
|
Untreated |
8.23 |
--- |

Fig. 3. Weed control with steam in spinach. Steam was applied to the soil at a 2” depth via shank injection prior to planting (a) and untreated control (b).
Prefar (bensulide) is an organophosphate herbicide that has been used for more than 50 years in Arizona for lettuce production. In fact, it is one of the standard herbicides used for this purpose.
The University of Arizona Vegetable IPM Team conducted a Yuma County and Imperial Valley Survey evaluating a portion of the acres checked by Pest Control Advisors. The 2017 data indicated that in 58% of the lettuce acreage reported was treated with Prefar. Similarly, in the 2018 survey 52% received a Prefar application.
This product performs well when incorporated with sprinkler irrigation at stand establishment. It also works best in course textured soil’s such as the ones found in Coachella Valley, California. One of the weeds controlled by Prefar is pigweed (Amaranthus palmeri), which was found to be resistant to glyphosate herbicide in Arizona by Dr. William B. McCloskey in 2012. Other weeds are purslane (Portulaca oleracea), goosefoot (Chenopodium murale), Lambquarter (Chenopodium album), and some species of grasses.
The list of crops in which bensulide is used demonstrates the importance of this weed control tool for the agricultural industry.
According to the 1080 Pesticide Use Reporting Database provided by the Arizona Pest Management Center the list of crops includes: Arugula, Bok choy, Broccoli, Brussel Sprouts, Cabbage, Cantaloupe, Cauliflower, Celery, Cilantro, Corn, Cress, Endive, Fennel, Mustard, Kale, Lettuce, Onion, Parsley, Squash, Swiss chard, and others.
Please read the following contribution from Dr. Al Fournier on the EPA Notice- Petition to Revoke Organophosphate Tolerances: (including Bensulide).
Al Fournier, IPM Program Manager, Arizona Pest Management Center
10 August 2022
The EPA has extended its deadline for public comment on a Petition to Revoke Tolerances and Cancel Registrations for Certain Organophosphate Uses until September 25, 2022.
The petitioners, including United Farm Workers, Earthjustice, and several other groups, request that the Agency revoke all tolerances and cancel all associated registrations for food uses of 15 listed OPs, and further requests that the Agency complete its registration review process for these chemicals no later than October 1, 2022. The pesticides are currently at various stages of review, and the proposed deadline does not align with EPA’s published schedule to complete scientific reviews.
Among 15 Organophosphates named in the petition are 10 with reported uses in Arizona (bolded below). Those with known uses in lettuce and other produce include Bensulide (Prefar) and Acephate (Orthene).
Acephate, Bensulide, Chlorethoxyfos, Chlorpyrifos-methyl, Diazinon, Dichlorvos, Dicrotophos, Dimethoate, Ethoprop, Malathion, Naled, Phorate, Phosmet, Terbufos, Tribufos
Read the full EPA Notice here: https://www.regulations.gov/document/EPA-HQ-OPP-2022-0490-0001
To submit comments to the docket, use the following link: https://www.regulations.gov/commenton/EPA-HQ-OPP-2022-0490-0001
To contribute to Arizona Pest Management Center comments, contact Al Fournier