
This time last year we were experiencing extremely high fertilizer prices that were continually rising. Fertilizer prices had been steadily increasing throughout 2021 and then experienced an acceleration after the Russian invasion of Ukraine in February 2022. Throughout the desert Southwest and across the nation, high prices have continued for fertilizers used in crop production agriculture over the past year. Now in early 2023 fertilizer prices are starting to decline but are still relatively high compared to prices two years ago. These patterns are shown in Figure 1.
There are at least four important lessons or messages from these recent experiences with global fertilizer prices and the impacts at the field level in crop production systems. First, many people have come to recognize that among global nitrogen (N), phosphorus (P), and potassium (K) fertilizer producers China, Russia, and Belarus are major players and are consistently in the top 10 (Figure 2). Our awareness has been heightened in response to the diminished supply available to U.S. markets from these three nations in the past year. The U.S. ranks fourth in overall N, P, and K fertilizer production.
Secondly, as fertilizer use has increased in many parts of the world in the past 60 years, the U.S. now represents only 10% share of the global use of N, P, and K fertilizers (Figure 3).
The third point that has been emphasized and has become increasingly clear to the crop production industry, is the connection between fertilizer production input costs, particularly natural gas, and fertilizer prices (Figure 4). Fertilizer production facilities require a large amount of energy to convert the raw chemical materials into their applicable farm-use state. This is very important in terms of N fertilizers.
Regarding prospects for global fertilizers, experts in the industry have the common variance in points of view but there seems to be a general agreement that higher prices have been a function of reduced supply and that was further exacerbated by the Russia-Ukraine war, the loss of a major port for Belarus potash fertilizer, and the P fertilizer supply constraints from China (Baffes and Koh, 2023).
These pressures are not going away soon, but the impacts have diminished in recent months. The constraints on supplies of P and K fertilizers are expected to continue for quite some time into the future. Price reductions have been most notable for N fertilizers, primarily due to lower natural gas prices in Europe compared to 2022.
Crop Nutrient Management
The fourth point of emphasis regarding fertilizer prices and desert crop production systems has been the shift towards more conservative management of fertilizers in the field.
Developing a conservative approach to nutrient management is often considered a risky venture in crop production systems, particularly with a short season crop like a leafy green vegetable that has a premium on quality as well as yield. However, under high fertilizer price conditions and/or tight supply, there is a greater incentive to develop and employ a more conservative approach to nutrient management.
To maximize nutrient management efficiency, the 4R concept of plant nutrient management and application can be helpful. The 4R concept consists of applying:
1. The Right fertilizer source at the
2. Right rate, at the
3. Right time and in the
4. Right place
Along with the 4R nutrient management approach, an assessment of plant-available forms of the nutrients present in the soil by evaluating soil tests with appropriate indices is a good step in the development of a more efficient nutrient management program. Then splitting nutrient applications, particularly mobile nutrients such as N in line with crop uptake and utilization patterns are good steps towards higher fertilizer use efficiency by the crop. Thus, timing, methods, and rates of nutrient applications are critical (i.e., 4R management).
In agriculture we know quite well that we have no control over markets and the costs of crop production inputs. However, we can control these inputs in the field, and we do have some tools at our disposal that can be helpful in the process.
References:
Baffes, J, W. C. Koh. 2023. Fertilizer prices ease but affordability and availability issues linger. 5 January 2023, World Bank. https://blogs.worldbank.org/opendata/fertilizer-prices-ease-affordability-and-availability-issues-linger
Crawford, A, F. Jomo, E. Elkin, and M. Bristow. 2023. World’s fertilizer market in turmoil. Bloomberg, Farm Progress, 20 February 2023. https://www.farmprogress.com/crops/world-s-fertilizer-market-in-turmoil
Quinn, R. 2023. DTN retail fertilizer trends. DTN Progressive Farmer, 15 March 2023.
https://www.dtnpf.com/agriculture/web/ag/crops/article/2023/03/15/anhydrous-uan-move-even-lower?referrer=NLSnapshot
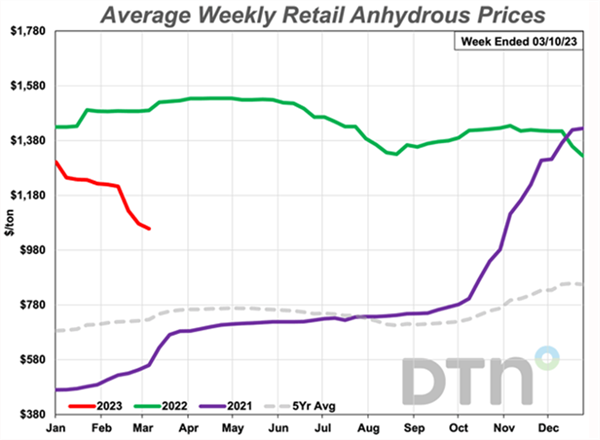
Figure 1. Average weekly retail prices for anhydrous ammonia (82% N), for
2021, 2022, and through 10 March 2023. Source: DTN/Quinn, 2023.
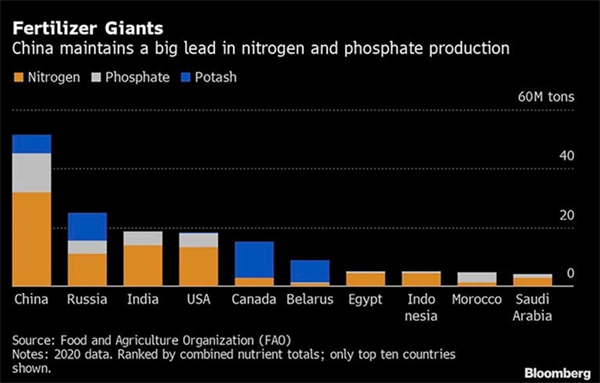
Figure 2. Ranked nitrogen, phosphorus, and potassium fertilizer production by
country. (FAO and Bloomberg graphics). Crawford et al., 2023.
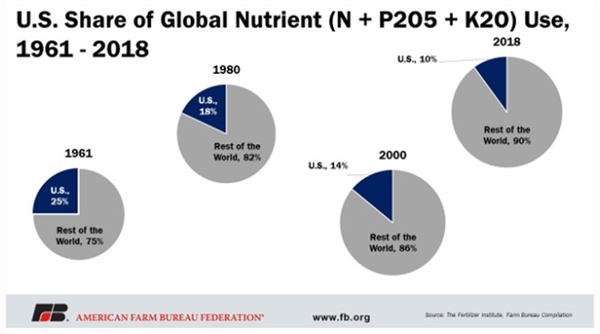
Figure 3. Pattern of U.S. share in the global nutrient market since
1961. Source: Farm Bureau.
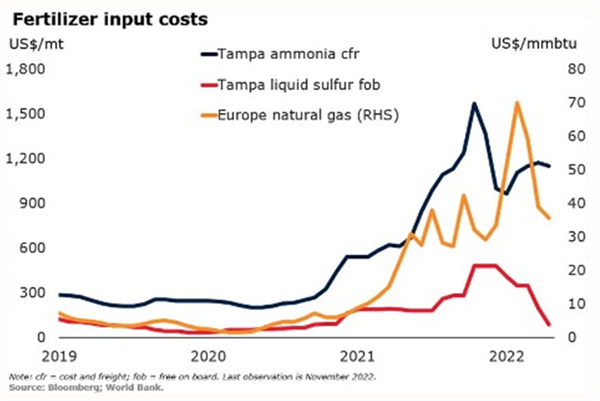
Figure 4. Fertilizer input cost trends, 2019-2022. Source: Bloomberg; World
Bank. Baffes and Koh, 2023.
I am seeking samples of downy mildew on lettuce from around Yuma County to support the Michelmore Lab and their ongoing efforts to help characterize the downy mildew populations of the United States. The Michelmore Lab has led the charge on a survey of Bremia variants since 1980 and has been instrumental in demystifying the gene-for-gene nature of lettuce resistance to downy mildew.
Their group invites growers across the United States to submit downy mildew infected plant samples, which are then used to culture the Bremia on live host plants. The team then inoculates a panel of lettuce varieties carrying known resistance genes to determine the race of each isolate they receive. Identifying which races occur in which specific fields is essential to guiding the breeding of new resistant cultivars and maximizing the effectiveness of host-based genetic disease management. The data obtained from these tests are also used to designate new Bremia races through the International Bremia Evaluation Board.
Your contribution will help breed better lettuce for Yuma. This means less breakdown of resistance in the field, and better yields for Yuma growers. To facilitate these submissions the Yuma Plant Health Clinic will be setting up a separate drop-off point and submission sheet for downy mildew sample submissions in the same hallway we use for standard plant diagnostic submissions. The drop-off point will be clearly labelled and consist of a chest-style refrigerator and printed copies of the submission form. It is vital to keep these samples cool so they remain viable for future inoculations, so please place your samples inside of the refrigerator before you leave.
Shipping will be handled by the clinic. All we ask is that you fill out the submission form as completely as you can. An example of the questions that are asked in that form so you can prepare ahead of time can be found HERE .At last week’s 3rd AgTech Field Demo: Automated and Robotic Technologies in Yuma, AZ, 15 of the latest automated and robotic technologies were demonstrated in the field. Most were designed to control weeds in vegetable crops. Several of the technologies demonstrated are brand new to the Yuma, AZ area, still under development and/or have never been shown to a general audience. Some of the new technologies demoed included an autonomous robotic weed puller, a precision spot sprayer, and a laser weeder (Fig. 1). These technologies are intriguing and offer a different approach to automated weeding systems currently on the market. It will be interesting to see how these machines fit into our current cropping systems and evolve in the future. Obviously, to be commercially viable, the machines must be cost effective. If interested, I would be more than happy to work with you to help conduct and design experiments for assessing weeding machine performance – % weed control, hand weeding labor savings, machine work rate (acres/hour), crop yield, operating cost, etc. Please feel free to contact me anytime at siemens@cals.arizona.edu.
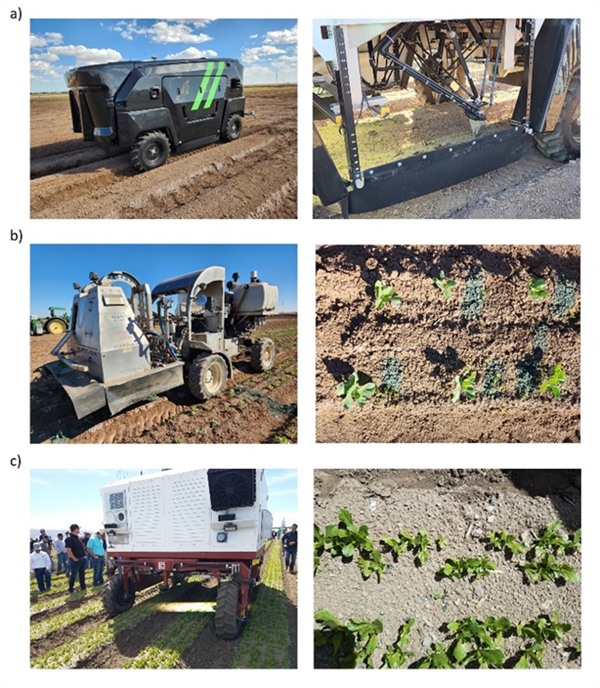
Fig. 1. Automated and robotic weeding technologies demonstrated at the
University of Arizona’s 3rd AgTech Field Demo included a) Nexus
Robotics’1 autonomous weeding pulling robot, b) Mantis Ag Technology’s spot
spray weeder and c) Carbon Robotics’ laser weeder.
What is the difference between resistance to herbicide and tolerance? Sometimes we use the terms inconsistently or interchangeably. For example, some manufacturers of transgenic varieties refer to them as herbicide-tolerant entities and other authors refer to them as resistant-varieties.
The WSSA (1998) helped us define this concept:
Tolerance is the “inherent ability of a species to reproduce and survive after herbicide treatment”. This means no selection or genetic manipulation occurred to create it, the plant is “naturally tolerant”. Some weeds are pulled around to some herbicides due to morphological, physiological, and genetic plant characteristics.
Resistance is the “ability of a plant to survive and reproduce following an exposure to an herbicide dose that is normally lethal to the wild type” of that species1. Resistant weeds appear due to genetic selection by herbicide over a period of time. This usually take several lifecycles.
We are evaluating some fields at the Yuma Mesa in Yuma, AZ for possible Pigweed (Amaranthus palmeri) resistance to glyphosate. In one case after the application of glyphosate we can see dead plants as well as perfectly healthy plants next to each other, which indicates the presence of resistant individuals. In other case plants do not show symptoms of herbicide activity except when applying an extremely high rate (8x) of glyphosate.
It is very important to examine the field history. For instance, if the field is coming from citrus and only glyphosate was used frequently it is possible you inherited the problem of weed resistance. Will continue with our evaluations and keep you informed of our findings.
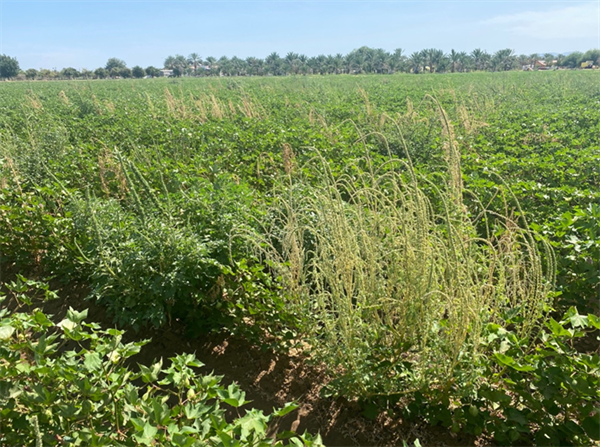
Figure 1. Susceptible and Non-Susceptible Pigweed (Amaranthus palmeri) after
glyphosate application.
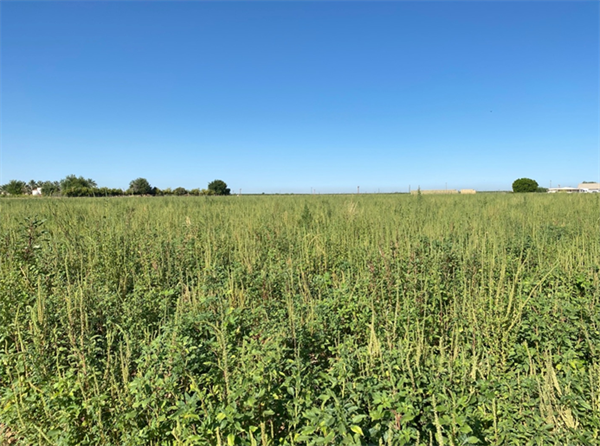
Figure 2. Pigweed (Amaranthus palmeri) population not showing symptoms
after glyphosate application.
Reference: