Crop Consumptive Use and Measurement
While striving to continually improve efficiency in the management of our irrigation systems, it is important to understand basic crop water use patterns. Estimating and tracking actual crop-water use can be a valuable tool in understanding crop-water demand and irrigation management.
In desert crop production systems, water is the first limiting factor and irrigation is a primary driving force in the growth and development of the crop.
In the process of irrigating a field to support a crop, there are two primary objectives that we must address in a desert crop production system: 1) replenish the plant-available water in the soil profile and 2) provide sufficient irrigation water to accomplish the necessary leaching of soluble salts. In some cases, particularly with cool season plants, e.g. lettuce and cole crops, we sometimes irrigate to cool the soils for seed germination and stand establishment when seed placement is made in warm or hot soils.
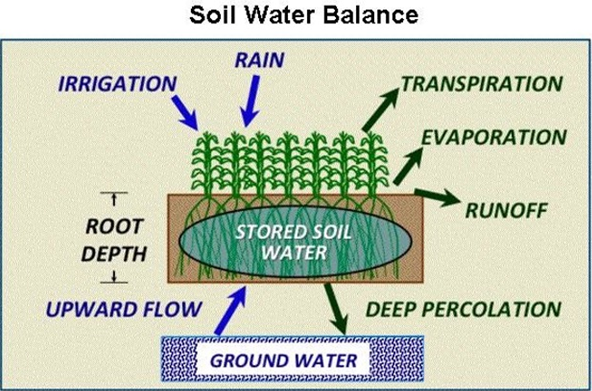
In a soil-plant system the dynamics of water-balance involves inputs (rainfall and/or irrigation) and several routes of possible water loss (Figure 1). The soil provides the water-holding capacity that offers water available for plant uptake through the root system. Ideally, we want all the irrigation water that we apply to be taken up by the crop for optimum plant health and water use efficiency.

Figure 1. Soil-water balance and plant relationships in a crop production system.
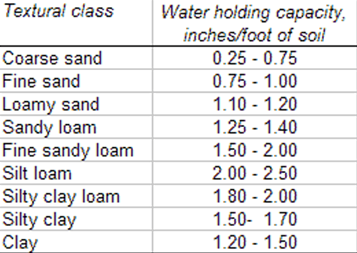
In managing irrigation events, we must take into consideration the amount of soil-water that has been depleted from the field by the crop since the last irrigation and we must also consider the water holding capacity of the soils in the field (Table 1). Deep percolation is often regarded as a loss of soil-water but in desert agriculture, but a sufficient degree of deep percolation is needed to remove soluble salts from the plant rootzone, e.g. leaching requirements.

Table 1. Soil texture and water holding capacity.
Comparing actual crop-water demand and crop irrigation practices can be important in our efforts to understand crop management needs and field-level irrigation efficiencies.
The collective loss of water from a field due to evaporation from the soil surface and transpiration of water vapor from the plants under standard conditions is referred to as “evapotranspiration, ET”.
Collectively, water used from the soil and plant system in a field is also referred to as “crop consumptive use”. It is important to understand this process to continually improve the management and stewardship of our water resources as we irrigate to replace water loss from the soil-plant system through the ET process, Figure 1.
The Arizona Meteorological Network (AZMET) system provides both historical and real-time weather information that can be used to track reference evapotranspiration (ETo) measured at a standardized and properly calibrated weather station site. This information can be valuable in crop water and irrigation management.
Reference evapotranspiration values can be obtained daily from AZMET for the nearly 30 sites in Arizona, including the Yuma area and the lower Colorado River Valley. Reference evapotranspiration (ETo) values multiplied by an appropriate crop coefficient (Kc) can provide very good estimates on actual crop evapotranspiration (ETc) rates as shown in the following equation:
ETc = ETo * Kc
The appropriate Kc values are specific for each crop species and stage of growth. We have commonly used crop coefficient Kc values that are provided in the publication “Consumptive Use by Major Crops in the Desert Southwest” by Dr. Leonard Erie and his colleagues, USDA-ARS Conservation Research Report No. 29. In recent years, we now use the Kc values found in the publication FAO 56 “Crop Evapotranspiration-Guidelines for Computing Crop Water Requirements-FAO Irrigation and Drainage Paper 56” (Allen et al., 1998). Reference information for Kc values can be obtained in these publications for common crops grown in this region.
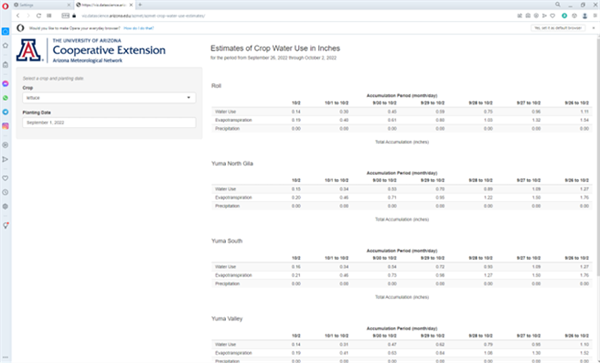
Dr. Jeremy Weiss, program manager for the University of Arizona AZMET system, has recently developed a valuable tool that provides actual crop evapotranspiration (ETc) estimates from several AZMET sites in the lower Colorado River Valley and for several key vegetable crops. Accumulations of ETc values over the previous week are shown based on a specific crop and date of planting, which are selected by the user. In this model, the Kc values presented in FAO-56 are used for appropriate stages with each crop. The ETo measurements are taken directly from each AZMET site listed.
To access this crop-water estimate tool please refer to the following link:
https://viz.datascience.arizona.edu/azmet/azmet-crop-water-use-estimates/
For example, using lettuce (either iceberg or romaine) and 1 September planting date, we can see from this model that accumulative ETc from 9/15/22 to 9/20/22 is 1.06 inches in the North Gila Valley and 0.90 in the Yuma Valley.

Figure 2. Example of AZMET Crop Water Use estimates on 3 October 2022 for lettuce planted on 1 September 2022 in the lower Colorado River Valley.
The next step with the development of this crop-water management tool will be to include cumulative crop water use, cumulative ETc, during the growing season for a given crop and planting date in the lower Colorado River areas.
Dr. Weiss and I are working with this model in the field to evaluate and test it. This crop water use tool can serve a valuable role in our continued efforts to improve irrigation and water management efficiencies. I encourage farmers, agronomists, and field crop managers to review this information and check that against depletion rates of soil plant-available water actually observed in the field.
We appreciate your review and any feedback and/or suggestions you may have.
References
Allen, R. G., Pereira, L. S., Raes, D., & Smith, M. (1998). Crop evapotranspiration-Guidelines for computing crop water requirements-FAO Irrigation and drainage paper 56. FAO, Rome, 300(9), D05109.
Erie, L.J., O.A French, D.A. Bucks, and K. Harris. 1981. Consumptive Use of Water by Major Crops in the Southwestern United States. United States Department of Agriculture, Conservation Research Report No. 29.
This study was conducted at the Yuma Valley Agricultural Center. The soil was a silty clay loam (7-56-37 sand-silt-clay, pH 7.2, O.M. 0.7%). Spinach ‘Meerkat’ was seeded, then sprinkler-irrigated to germinate seed Jan 13, 2025 on beds with 84 in. between bed centers and containing 30 lines of seed per bed. All irrigation water was supplied by sprinkler irrigation. Treatments were replicated four times in a randomized complete block design. Replicate plots consisted of 15 ft lengths of bed separated by 3 ft lengths of nontreated bed. Treatments were applied with a CO2 backpack sprayer that delivered 50 gal/acre at 40 psi to flat-fan nozzles.

Downy mildew (caused by Peronospora farinosa f. sp. spinaciae)was first observed in plots on Mar 5 and final reading was taken on March 6 and March 7, 2025. Spray date for each treatments are listed in excel file with the results.
Disease severity was recorded by determining the percentage of infected leaves present within three 1-ft2areas within each of the four replicate plots per treatment. The number of spinach leaves in a 1-ft2area of bed was approximately 144. The percentage were then changed to 1-10scale, with 1 being 10% infection and 10 being 100% infection.
The data (found in the accompanying Excel file) illustrate the degree of disease reduction obtained by applications of the various tested fungicides. Products that provided most effective control against the disease include Orondis ultra, Zampro, Stargus, Cevya, Eject .Please see table for other treatments with significant disease suppression/control. No phytotoxicity was observed in any of the treatments in this trial.
Want to see this Prototype Band-Steam Applicator in action? Click on the link or the image
https://www.youtube.com/watch?v=AEY4wHo7vgo