Being able to accurately track crop development and then to describe and predict important stages of crop growth and development (crop phenology) and harvest dates is important for improving melon (Cucumis melo ‘reticulatus’ L.) crop management (e.g. fertilization, irrigation, harvest scheduling, pest management activities, labor, and machinery management, etc.). It is best to monitor and predict plant development based on the actual thermal conditions in the plant’s environment. Thermal conditions are a more reliable measure and predictive tool for plant development as opposed to a calendar, simply because plant growth is a direct response to temperature and environmental conditions.
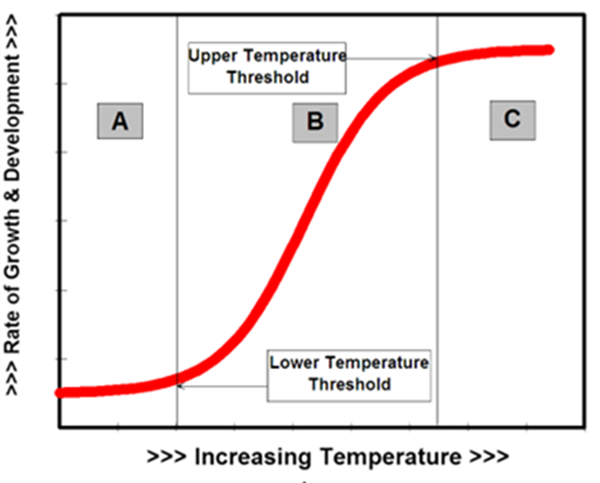
Various forms of temperature measurements and units commonly referred to as heat units (HU), growing degree units (GDU), or growing degree days (GDD) have been utilized in numerous studies to predict phenological events for many crop plants (Baskerville and Emin, 1969; Brown, 1989; Baker and Reddy, 2001; and Soto, 2012). A graphical depiction of HU computation using the single sine curve procedure is presented in Figure 1 (Brown, 1989).
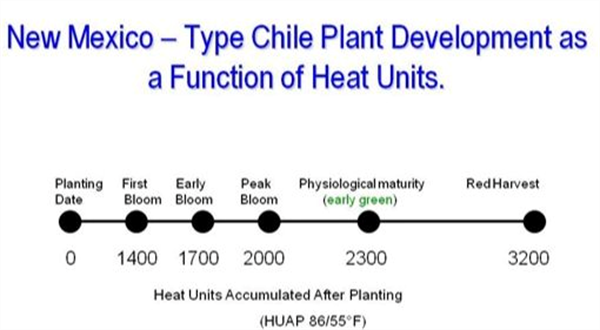
Twenty-five years ago we began working on the development and annual testing of a phenology model for desert cantaloupe production for Arizona conditions. The basic cantaloupe phenology model is shown in Figure 2 (Silvertooth, 2003; Soto et al., 2006; and Soto, 2012). Since cantaloupes are a warm season crop, we use the 86/55 ºF thresholds for phenological tracking.
This melon crop phenology model was developed under fully irrigated and well-managed conditions. That is important since non-irrigated fields are more likely to experience water stress, which significantly disrupts crop development patterns.
Key stages of growth or “guideposts” indicated in Figure 2 represent general average or “target” values that are subject to a slight degree of natural variation, which is normal.
Referencing the data from the Arizona Meteorological Network (AZMET) and several locations in the Yuma area, the HU accumulations (86/55 ºF thresholds) from 1 January 2025 to a set off our possible 2025 planting dates are listed in Table 1. The HU accumulations from 1 January 2025 to 30 March 2025 are listed in Table 2.
The HU accumulations after planting (HUAP) for these four possible planting dates for three Yuma area locations to 30 March 2025 are shown in Table 3. The HUAP values in Table 3 are simply the difference between the values in Tables 1 and 2. An example for the Yuma Valley, 15 January 2025 planting date is: 718.7 HU - 73.1 HU = 645.6 ~ 646 HUAP.
It is rather easy to test and evaluate this crop phenology model in the field under various planting dates, varieties, and conditions. The information in Table 3 can help serve as a reference to check for melon crop development in the field against this phenological model in Figure 2.
For melon crops in the lower Colorado River Valley, we would currently expect to find fields planted and watered up in mid-January to have small melons approaching golf-ball size and fields planted in early March should be starting to show fresh blooms soon.
Table 1. Heat unit accumulations (86/55 ºF thresholds) after 1 January 2025 on four possible 2025 planting dates utilizing Arizona Meteorological Network (AZMET) data for each representative site.
Yuma Valley: https://azmet.arizona.edu/application-areas/heat-units/station-level-summaries/az02
Yuma North Gila: https://azmet.arizona.edu/application-areas/heat-units/station-level-summaries/az14
Roll: https://azmet.arizona.edu/application-areas/heat-units/station-level-summaries/az24
Table 2. Heat unit accumulations (86/55 ºF thresholds) after 1 January 2025 to 30 March 2025 utilizing Arizona Meteorological Network (AZMET) data for each representative site.
Table 3. Heat unit accumulations (86/55 ºF thresholds) after planting (HUAP) from four possible 2025 planting dates and three sites in the Yuma area utilizing Arizona Meteorological Network (AZMET) data for each representative site. Each value is rounded to the next whole number. Note: the values in Table 3 are determined by taking the difference between the HUs for each representative site and four planting dates in Tables 1 and 2.
Figure 1. Graphical depiction of heat unit computation using the single sine curve procedure. A sine curve is fit through the daily maximum and minimum temperatures to recreate the daily temperature cycle. The upper and lower temperature thresholds for growth and development are then super imposed on the figure. Mathematical integration is then used to measure the area bounded by the sine cure and the two temperature thresholds (grey area). (Brown, 1989)
Figure 2. Heat Units Accumulated After Planting (HUAP, 86/55 °F)
Interested in the latest developments in automated weeding machines and ag tech? There are a couple of opportunities at the upcoming 2025Southwest Ag Summit to stay up to date. One is the “Ag Tech: Innovations in Weed Control and Vegetable Crop Production Technologies” breakout session where university experts and cutting-edge innovators will provide updates on the latest advances in AI high precision smart spot sprayers and soil steaming for pest control (agenda below). The session will be held Thursday, February 20th from 1:30-3:30 pm at Arizona Western College (AWC) in Yuma, AZ.
The other is the Southwest Ag Summit Field Demo on Wednesday, February19th, where several of these technologies and other state-of-the-art automated weeders will be demonstrated operating in the field. The Field Demos will also be held at AWC. Breakfast will be served at 7:00 am and demonstrations begin at 8:00 am.
For more information about the Southwest Ag Summit, visit https://yumafreshveg.com/southwest-ag-summit/.
According to some authors "the human brain can process images up to 60,000 times faster than words"1. So, I decided to share images of some of the onion herbicide tests we did at the Yuma Ag Center last season hoping you find them interesting as the season progresses. As you know the products tested could respond differently under different environments. Also some of these trials are done searching for new alternatives, therefore products are not registered.
As the weather gets cooler, aphids are migrating back to the desert to harm our crops. It is important to revisit some factors that may favor aphid infestations in your crops, specifically lettuce, and take appropriate action against them.
Nitrogen availability is one of the most important factors in the development of insect pest populations. Excessive application of nitrogen fertilizer to crops will likely increase the feeding preference and consumption rate of insect pests such as aphids, resulting in greater survival, growth, and reproduction. In some situations, high nitrogen levels in plant tissue can decrease resistance and increase susceptibility to aphids’ attacks.
Water management is also very important to consider. Excess water around plant roots can increase nitrogen uptake, which may favor an increase in the aphid population. Thus, supplying proper amounts of nitrogen and water to your crops can tremendously help with aphid management. See this link for more information on this topic.Estimation of evapotranspiration for specific crops (ETc) is important for irrigation scheduling and agricultural water management. ETc for crops such can be estimated using the following equation:
ETc = ETo x Kc
Where ETo is the evapotranspiration (ET) of a reference crop (usually grass or alfalfa), which is commonly called reference ET Reference ET (ETo) is defined as the ET from a 3-6" tall cool season grass that completely covers the ground and is supplied with adequate water. ETo is commonly used mostly in the eastern, southern, southeastern, and western U.S.
Reference ET (ETr) assumes a reference surface of tall grass (or alfalfa-20" tall) that completely covers the ground and is supplied with adequate water. ETr is more commonly used in the Midwest.
Both ETc and ETo can be expressed in units of water depth per unit of time, such as inches per day, inches per week, or inches per month. ETo is usually estimated using equations that use weather variables as inputs. These variables include solar radiation, air temperature, wind speed, and relative humidity. Reference ET or ETo can be obtained from AZMET Weather Data (https://cales.arizona.edu/AZMET/az-data.htm)
Figure 1: The Arizona Meteorological Network
The Kc is an adjustment factor called the “crop coefficient,” which mainly depends on the type of crop and its growth stage. Usually determined experimentally. Each agronomic crop has specific crop coefficients to predict water use rates at different growth stages and could be obtained from university extension or agricultural research center.
Example 1:
A lettuce crop is at the KcD growth stage, with a crop coefficient (Kc) of 0.80 (as indicated in the Kc table). The reference evapotranspiration (ETo) from October 20 to 24 is 1.20 inches over a 7-day period since the last irrigation, based on AZMET data. Determine the actual crop evapotranspiration (ETc), which also represents the total irrigation requirement, assuming the irrigation system operates at 100% efficiency.
Solution:
ETc=ETo *Kc
Kc @ KcD is 0.80
ETo = 1.20 inches
ETc: 1.20 inches * 0.80
= 0.96 inches is actual crop water use which is total irrigation requirement that needs to apply.