There is a lot of discussion these days regarding the need for crop production systems in Arizona to improve upon the efficiencies of our irrigation systems. The focus on irrigation efficiencies has been accentuated with the current water shortages being experienced in many parts of the state and region, particularly with the Colorado River system.
Despite the focus on irrigation efficiency and the abundance of discussions and advice for the crop production community on how to go about the business of irrigating and producing a crop, very little, if any, comment is being made to define what is meant by “irrigation efficiency”.
There are several ways to define irrigation efficiency. The primary definitions for irrigation efficiency include orientations with water conveyance and delivery systems, agronomic, economic, and environmental efficiencies.
Water Conveyance and Delivery System Efficiency
In the desert Southwest we have the benefit of incredible engineering with the highly developed systems of dams, primary canals, pumps, laterals, and secondary canals that move water from rivers and groundwater supplies to areas of need, which are commonly managed by irrigation districts. Our ability to move water from the original source to the field is a critical aspect of managing water resources and there is an “efficiency” consideration in terms of how water is conveyed from the source to the field. This level of efficiency is largely a function of system engineering and design and the system management.
Agronomic Irrigation Efficiency
Agronomic (crop and soil) considerations are centered on our ability to provide irrigation water for the sustainable production of a crop in the field. The three primary demands for crop water management include: 1) providing water for seed germination and stand establishment, 2) providing irrigation water to match crop-consumptive water use, and 3) sufficient irrigation water to leach soluble salts from the root zone so that the soils can support crop production in a sustainable manner (Figure 1).
Agronomic efficiency at the field level focuses on the crop water demand (CWD) through crop consumptive use (ETc, which is the combination of evaporation and transpiration from the crop) and leaching requirements (LR, which are dependent upon the crop and salinity of the irrigation water).
Agronomic efficiency can be estimated by considering the difference between ETc + LR = CWD and the volume of irrigation water applied (IWA).
Leaching Requirement (LR) can be estimated by use of the following calculation:
Where:
ECw = salinity of the irrigation water, electrical conductivity (dS/m)
ECe = critical plant salinity tolerance, electrical conductivity (dS/m)
This is a good method of a LR calculation that has been utilized extensively and successfully in Arizona and the desert Southwest for many years. We can easily determine the salinity of our irrigation waters (ECw) and we can find the critical plant salinity tolerance level from easily available tabulations of salinity tolerance for many crops (Ayers and Westcot, 1989). Additional direct references are from Dr. E.V. Maas’ lab at the University of California (Maas, 1984: Maas, 1986; Maas and Grattan, 1999; Maas and Grieve, 1994; and Maas and Hoffman, 1997).
Economic Efficiency
Economic efficiency is often considered to be primary factor defining the financial sustainability of a farming operation. Water is a crop input and the costs associated with irrigating a crop includes the cost of the water directly and costs of delivery (pumps, equipment, maintenance, labor, etc.). Economic efficiency essentially considers the “return on the investment” and profitability of irrigating a crop.
Environmental Efficiency
Considerations of irrigation efficiency from an environmental perspective is very broad and encompassing and it can include a combination of efficiencies previously discussed (water conveyance systems, agronomic, and economic considerations). Environmental efficiency is a collective line of consideration regarding overall stewardship of water as a natural resource and beneficial use.
Estimating Field Level Irrigation Efficiencies
The focal point of any irrigation system, from the regional, district, farm, and field levels is to provide water to produce a crop. The crop is the centerpiece of the entire operation. Thus, I believe it is most appropriate to consider irrigation efficiency at the field level in agronomic terms, by use of Equation 1.
We need three factors to estimate field level irrigation efficiency for a crop: 1) crop evapotranspiration (ETc), 2) the crop and field leaching requirement (LR), and 3) a measure of the irrigation water applied to the field in question (IWA).
To determine crop evapotranspiration (ETc) we need a good reference evapotranspiration (ETo) measurement for the field site in question. Reference evapotranspiration (ETo) values multiplied by an appropriate crop coefficient (Kc) can provide very good estimates on actual crop evapotranspiration (ETc) rates as shown in the following equation:
The appropriate Kc values are specific for each crop species and stage of growth. We commonly use crop coefficient Kc values that are provided in the publication “Consumptive Use by Major Crops in the Desert Southwest” by Dr. Leonard Erie and his colleagues, USDA-ARS Conservation Research Report No. 29 and now most commonly from the publication FAO 56 “Crop Evapotranspiration-Guidelines for Computing Crop Water Requirements-FAO Irrigation and Drainage Paper 56” (Allen et al., 1998). Reference information for Kc values can be obtained in these publications for common crops grown in this region.
Example
If we consider an example lettuce crop irrigated with water that has ECw = 1.1 dS/m and the crop water demand (CWD) = 30 inches
Using Equations 1-3, an overall estimate of field level irrigation efficiency can be made. From Equation 2 we can estimate the leaching requirement.
ECw = 1.1 dS/m and ECe (lettuce) = 1.3 dS/m
LR = 1.1 dS/m / (5 X 1.3) – 1.1 = 1.1/5.4 = 0.20 = 20% leaching requirement
LR = 30 X 0.2 = 6.1 ~ 6 inches
Thus, CWD = 30 + 6 = 36 inches total
Assume: 40 inches of irrigation water was applied.
Agronomic efficiency (from Equation 1) = 36/40 = 0.9 = 90% efficiency
Note: If the LR were not included in the total CWD, efficiency would be: 30/40 = 75%
That is an important difference and distinction to understand and demonstrate.
The Arizona Meteorological Network (AZMET) system provides both historical and real-time weather information that can be used to track reference evapotranspiration (ETo) measured at a standardized and properly calibrated weather station site. Reference evapotranspiration values can be obtained daily from AZMET for the nearly 30 sites in Arizona, including the Yuma area and the lower Colorado River Valley. Very importantly, the AZMET is very high quality and the integrity of the system has been constantly managed for over 35 years, first under the direction of Dr. Paul Brown and now with Dr. Jeremy Weiss. This information can be valuable in crop water and irrigation management.
Dr. Jeremy Weiss, program manager for the University of Arizona AZMET system, has recently developed a valuable tool that provides actual crop evapotranspiration (ETc) estimates from several AZMET sites in the lower Colorado River Valley and for several key vegetable crops. Accumulations of ETc values over the previous week are shown based on a date of planting, which is selected by the user. In this model, the Kc values presented in FAO-56 are used for appropriate stages with each crop. The ETo measurements are taken directly from each AZMET site listed.
Dr. Weiss has included the next step with the development of this crop-water management tool that can provide the cumulative crop water use, cumulative ETc, during the growing season for a given crop and planting date for common leafy green vegetable crops in the lower Colorado River areas.
To access this crop-water estimate tool please refer to the following link:
https://viz.datascience.
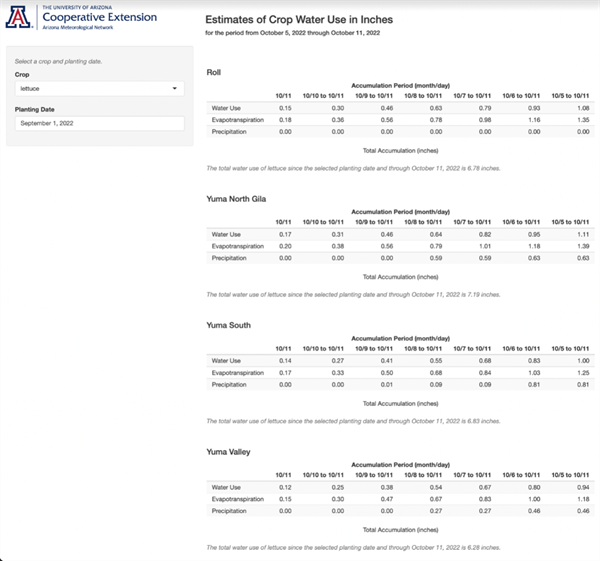
For example, using lettuce (either iceberg or romaine) and 1 September planting date, we can see from this model that cumulative ETc from 10/5/22 to 10/11/22 is 1.11 inches in the North Gila Valley and 0.94 inches in the Yuma Valley (Figure 2). Cumulative ETc since the planting date is 7.19 and 6.28 inches for these two stations, respectively.
Dr. Weiss and I are working with this model in the field to evaluate and test it. I encourage farmers, agronomists, and field crop managers to review this information and check that against depletion rates of soil plant-available water in the field.

Figure 1. Soil-water balance and plant relationships in a crop production system.

Figure 2. Example of AZMET Crop Water Use estimates for lettuce planted on 1 September 2022 in the lower Colorado River Valley.
References
Allen, R. G., Pereira, L. S., Raes, D., & Smith, M. (1998). Crop evapotranspiration-Guidelines for computing crop water requirements-FAO Irrigation and drainage paper 56. FAO, Rome, 300(9), D05109.
Ayers, R.S. and D.W. Westcot. 1989 (reprinted 1994). Water quality for agriculture. FAO Irrigation and Drainage Paper 29 Rev. 1. ISBN 92-5-102263-1. Food and Agriculture Organization of the United Nations Rome, 1985 © FAO.
https://www.fao.org/3/t0234e/
Erie, L.J., O.A French, D.A. Bucks, and K. Harris. 1981. Consumptive Use of Water by Major Crops in the Southwestern United States. United States Department of Agriculture, Conservation Research Report No. 29.
Maas, E.V. 1984. Crop tolerance to salinity. California Agriculture, October 1984. https://calag.ucanr.edu/
Maas, E.V. 1986. Salt tolerance of plants. Appl. Agric. Res., 1, 12-36.
Maas, E.V. and S.R. Grattan. 1999. Crop yields as affected by salinity, Agricultural Drainage, Agronomy Monograph No. 38.
Maas, E. V., and Grattan, S. R. (1999). Crop yields as affected by salinity, agricultural
drainage, Agronomy Monograph No. 38, R. W.
Maas, E. V., and Grieve, C. M. 1994. “Salt tolerance of plants at different growth stages,” in Proc., Int. Conf. Current Developments in Salinity and Drought Tolerance of Plants. January 7–11, 1990, Tando Jam, Pakistan, 181–197.
Maas, E. V., and Hoffman, G. J. (1977). “Crop salt tolerance: Current assessment.”
This study was conducted at the Yuma Valley Agricultural Center. The soil was a silty clay loam (7-56-37 sand-silt-clay, pH 7.2, O.M. 0.7%). Spinach ‘Meerkat’ was seeded, then sprinkler-irrigated to germinate seed Jan 13, 2025 on beds with 84 in. between bed centers and containing 30 lines of seed per bed. All irrigation water was supplied by sprinkler irrigation. Treatments were replicated four times in a randomized complete block design. Replicate plots consisted of 15 ft lengths of bed separated by 3 ft lengths of nontreated bed. Treatments were applied with a CO2 backpack sprayer that delivered 50 gal/acre at 40 psi to flat-fan nozzles.

Downy mildew (caused by Peronospora farinosa f. sp. spinaciae)was first observed in plots on Mar 5 and final reading was taken on March 6 and March 7, 2025. Spray date for each treatments are listed in excel file with the results.
Disease severity was recorded by determining the percentage of infected leaves present within three 1-ft2areas within each of the four replicate plots per treatment. The number of spinach leaves in a 1-ft2area of bed was approximately 144. The percentage were then changed to 1-10scale, with 1 being 10% infection and 10 being 100% infection.
The data (found in the accompanying Excel file) illustrate the degree of disease reduction obtained by applications of the various tested fungicides. Products that provided most effective control against the disease include Orondis ultra, Zampro, Stargus, Cevya, Eject .Please see table for other treatments with significant disease suppression/control. No phytotoxicity was observed in any of the treatments in this trial.
As mentioned in a previous article, last month at the UC Cooperative Extension Automated Technology Field Day in Salinas, CA, several automated technologies were showcased operating in the field for the first time to a general audience. One of the “new” machines designed specifically for in-row weeding in vegetable crops was discussed previously, a second is highlighted here.
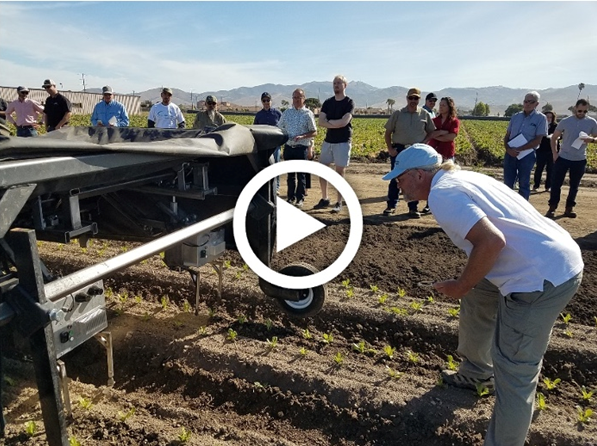
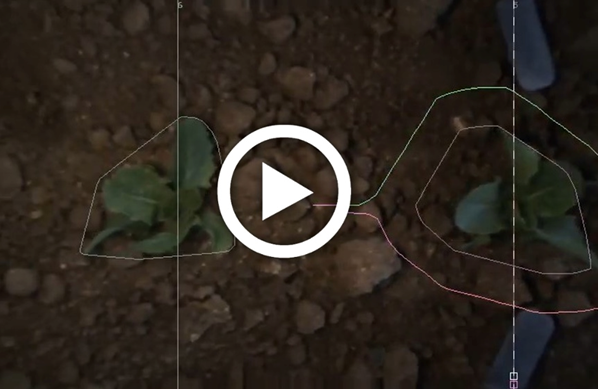
Vision Robotics1 (https://www.visionrobotics.com/) demoed an innovative mechanical in-row weeding machine (Fig. 1). As with most other automated weeding machines currently on the market, in-row weeds are controlled with knife blades that cycle in and out of the crop row. Each knife blade however is controlled independently by an electric motor rather than in coupled pairs. Another feature is that the imaging system calculates a prescribed path for the blades to follow based on a contour of the crop plant and a user defined offset distance from the contour (Fig. 2) Because electric motors are used, blade position can be continuously and precisely controlled, thus facilitating close cultivation.
In the demo, the prototype seemed to work pretty well, but the run was short, and it was difficult to fully evaluate its performance. The video they shared of their imaging system with path planning and blade movement operating in real time impressed and showed good promise (Fig. 2). The innovation was recently patented, and the company is planning commercial units for interested customers.
Developments such as these are worth investigating as our and other researchers’ studies have shown that automated in-row weeding machines control about 50-66% of the in-row weeds, and the majority of uncontrolled weeds were observed to be close to the crop plant (Lati et al., 2016; Mosqueda et al., 2021).
References
Lati, R.N, Siemens, M.C., Rachuy, J.S. & Fennimore, S.A. (2016). Intrarow Weed Removal in Broccoli and Transplanted Lettuce with an Intelligent Cultivator. Weed Technology, 30(3), 655-663.
Mosqueda, E., Smith, R. & Fennimore, S. 2021. 2020 Evaluations of automated weeders in lettuce production. ANR Blogs. Davis, Calif.: University of California Davis. Available at: https://ucanr.edu/blogs/blogcore/postdetail.cfm?postnum=45566.
Acknowledgements
A special thank you to Tony Koselka, Vision Robotics Inc., for uploading the videos referenced in this article.
____________________
[1] Reference to a product or company is for specific information only and does not endorse or recommend that product or company to the exclusion of others that may be suitable.

Fig. 1. Prototype in-row weeding machine developed by Vision Robotics1 demonstration at UCCE Automated Technologies Field Day. Clear here or on the image to view the machine in action.

Fig. 2. Plant contour and cultivating blade path planning of prototype in-row weeding machine developed by Vision Robotics1. A contour of the crop plant is traced (left) and a prescribed path a user defined distance from this contour (right) is determined for the blade tips to follow. Clear here or on the image to view the system in action.
As
we are all aware the most commonly used herbicides in lettuce production are
Kerb (Pronamide), Balan (Benefin), and Prefar (Bensulide). Our weed complex for
lettuce grown in the low desert includes summer annual weeds grasses and
broadleaves early in the season as well as winter annuals, which are a problem
during the cooler months. Most of these are controlled with preemergent
herbicides although escapes are common and must be controlled postemergence.
Occasionally when herbicides and cultural practices are not sufficient
expensive hand weeding is required for commercially acceptable weed control. To
illustrate numbers from our 2016 Crop losses report showed that 91% of the
lettuce surveyed required some hand hoeing even when 82% of the acres was
treated with Pronamide. Also Bensulide and Benefin were applied at lower
percent.
Therefore, evaluation of new effective herbicides is always welcomed. We
conducted a couple of projects at the Yuma Agricultural Center to look at weed
management in transplanted lettuce to determine Pre and Post-Transplant weed
control as well as crop safety of other active ingredients such as
S-metholachlor (Dual Magnum), Pendimethalin (Prowl), DCPA (Dacthal) and compare
them with Pronamide (Kerb) and other products.
Transplanting lettuce and the use of planting tape has opened the possibility
of using herbicides that injure direct seeded lettuce but may be safer to
plants with a developed root system. Additionally, they could show more
efficacy in controlling some weeds present in our area.
We are still collecting results from these trials and will publish them
soon in this Newsletter as well as in the upcoming Lettuce Crop Losses Workshop.

Prowl Applied Pre-transplant
Results of pheromone and sticky trap catches can be viewed here.
Corn earworm: CEW moth counts down in all traps over the last month; about average for December.
Beet armyworm: Moth trap counts decreased in all areas in the last 2 weeks but appear to remain active in some areas, and average for this time of the year.
Cabbage looper: Moths increased in the past 2 weeks, and average for this time of the season.
Diamondback moth: Adults increased in several locations last, particularly in the Yuma Valley most traps. Below average for December.
Whitefly: Adult movement remains low in all areas, consistent with previous years
Thrips: Thrips adult movement continues to decline, overall activity below average for December.
Aphids: Winged aphids still actively moving but declined movement in the last 2 weeks. About average for December.
Leafminers: Adult activity down in most locations, below average for this time of season.