
In desert crop production systems, water is the first limiting factor and irrigation is a primary driving force in the growth and development of the crop. In the process of irrigating a field to support a crop, there are two primary objectives that we must address in a desert crop production system: 1) replenish the plant-available water in the soil profile and 2) provide sufficient irrigation water to accomplish the necessary leaching of soluble salts.
In a soil-plant system the dynamics of water-balance involves inputs (rainfall and/or irrigation) and several routes of possible water loss (Figure 1). The soil provides the water-holding capacity that provides water available for plant uptake through the root system. Ideally, we want all the irrigation water that we apply to be taken up by the crop for optimum plant health efficiency.
In managing irrigation events, we must take into consideration the amount of soil-water that has been depleted from the field by the crop since the last irrigation and the water holding capacity of the soils in the field (Table 1). Deep percolation is often considered as a loss of soil-water but in desert agriculture, a sufficient degree of deep percolation is needed to remove soluble salts from the plant rootzone, e.g. leaching requirements (LR).
Irrigation is often considered as an engineering event and that it is true regarding the conveyance of water from a source and getting it to the field. However, the management of irrigation in the field, and particularly the management of both the timing and amount of irrigation, is completely an agronomic decision (crop and soil factors) based on the specific crop being grown, its stage of growth, and the soil textures in the field. The crop plant is the centerpiece in the system and the primary irrigation objective is to replenish the plant-available water in the soil for the benefit of the crop.
Basic Soil-Plant-Water Relations
For efficient management of irrigation water, there are several aspects of the total water in a soil that are important to recognize, and the primary water fraction of interest is referred to as the “plant-available soil-water” (PAW). Figure 2 provides a graphic illustration of three important components of soil water: 1) total water in the soil (TW), 2) PAW, and 3) and unavailable soil-water to plants.
After an irrigation, when the soil is saturated, there will be drainage of the water that the soil cannot physically hold, commonly referred to as drainage water, the leaching fraction, or the “gravitational water” (GW). The TW water is retained in the soil after the GW has moved out of the wetted zone. The TW is held in the soil due to the matrix forces of the soil particles adhering to that water. The TW remaining in the soil after the GW has drained away, contains the PAW and the non-available water that the soil holds by matrix forces stronger than what the plant extract (Figures 1, 2, and 3).
For practical field management of soil water, it is important to focus on the PAW for each soil and crop. It is important to understand that plants are not all created equal in terms of their capacity to extract water from a soil and some plants can extract more water from a given soil than other plants. For example, native desert plants (xerophytic plants) can extract much more water from a soil than most crop plants. Compared to native desert plants, our crop plants are much more sensitive. Therefore, the PAW illustrated in Figures 2 and 3 are general descriptions but they illustrate an important soil-plant relationship. Each plant species has its own capacity to extract water from the soil and we need to know and understand this characteristic of each crop that we are managing in the field as well as the water holding capacity of the soil. For example, lettuce and most leafy-green vegetable crops are more sensitive to water stress than crops like cotton, wheat, melons, alfalfa, sorghum, etc. Thus, leafy green vegetable crops must be maintained at a higher level of PAW to avoid water stress in contrast to some other crop plants such as cotton, wheat, etc.
Crop plants will draw upon the PAW fraction to sustain themselves physiologically and manage against water stress. Crop demands for water change as a function of stage of growth and environmental or weather conditions. Our fundamental irrigation management goal is to monitor the depletion of PAW in the soil and schedule an irrigation at the proper time and rate to replenish the PAW before the crop goes into water stress. That means we also need to identify the critical level of PAW for the crop in the field to determine when an irrigation is needed so we can avoid water stress on the crop.
The fact that different soil types, determined by soil texture, have different total and PAW holding capacities is well illustrated in Figure 2 and Table 1. Thus, it is important to know the soil type prevalent in any field to gauge the amount of PAW that a soil can hold. This will help determine to what extent the soil-water can be depleted and the amount of irrigation water needed to replenish the PAW.
Crop Consumptive Use and Measurement
Estimating and tracking actual crop-water use can be a valuable tool in understanding crop-water demand and irrigation management. Comparing actual crop-water demand and crop irrigation practices can be important in our efforts to understand crop management needs and field-level irrigation efficiencies.
Reference evapotranspiration (ETo) is the collective loss of water from a field due to evaporation from the soil surface and transpiration of water vapor from the plants under standard conditions. Collectively, water movement from the soil and plant systems in a field is referred to as “crop consumptive use” and it is important to understand this process in our efforts to steward our water resources most effectively.
The Arizona Meteorological Network (AZMET) system provides both historical and real-time weather information that can be used to track reference evapotranspiration (ETo) and assist in crop water and irrigation management. Reference evapotranspiration values can be obtained daily from AZMET for the nearly 30 sites in Arizona, including the Yuma area and the lower Colorado River Valley. The ETo values multiplied by an appropriate crop coefficient (Kc) can provide very good estimates on actual crop evapotranspiration (ETc) rates where ETo * Kc = ETc.
The appropriate Kc values are specific for each crop species and stage of growth. We commonly use crop coefficient Kc values that are provided in the publication “Consumptive Use by Major Crops in the Desert Southwest” by Dr. Leonard Erie and his colleagues, USDA-ARS Conservation Research Report No. 29 and now most commonly from the publication FAO 56 “Crop evapotranspiration-Guidelines for computing crop water requirements-FAO Irrigation and drainage paper 56” (Allen et al., 1998). Reference information for Kc values can be obtained in these publications for common crops grown in this region.
In-Field Irrigation Management
By understanding the level of PAW depletion in a soil and the critical point for the crop to avoid water stress, we can better estimate the amount of irrigation water needed to replenish the supply of PAW in the soil to support the crop appropriately. Fundamentally, this is described in a direct manner in the “Irrigator’s Equation”. To irrigate a field, we should know the area to be irrigated (A), the flow rate of water in the irrigation delivery ditch (Q), and the amount of water needed to replenish the PAW in the soil (d); then we can determine the proper time (t) or duration for an irrigation event and basically solve the Irrigator’s Equation. If we can get fast and uniform coverage of a level field to be irrigated, apply the proper volume of water to replenish the plant-available water supply to the soil, then cut off the flow of irrigation water into the field at the proper time; we can do a very good job of delivery for high water-use efficiency.
Irrigator’s Equation: Q x t = d x A
Where:
Q = the flow rate, in cubic feet per second (cfs);
t = the set time or total time of irrigation (hours);
d = the depth of water applied (inches) and
A = the area irrigated (acres).
Estimating Plant-Available Water
There are many methods and technologies to measure soil-water and PAW to assist in irrigation management. However, the most fundamental method is to sample a soil and estimate “plant-available” water status by “feel”, by literally holding the soil in your hand and estimating the amount of plant-available water that is present.
A good way to calibrate the feel method is to physically check the soil in a field a few hours after an irrigation event when the GW has drained away and the soil is at FC and gain a “self-calibration” for that soil-water level and how it feels. The next critical point to identify by the feel method is the soil-water content just before the plants begin to show any sign of water stress. The difference between those two points is the PAW that we are managing in the field for that crop. That critical point in the soil-water content that we need to recognize for managing irrigations for crop plants will still have a significant amount of PAW left in the soil but that is because the goal in crop management is to avoid plant water stress, which is signaled by the plant with wilting. Thus, that critical point for irrigating most crop plants is to do so just before the plant begins to experience water stress and show any sign of wilting.
To determine the moisture level in the soil we need to dig down with a shovel, soil probe, or with a soil auger to at least a depth of about 6-12 inches to get a representative soil sample. In general, for many crops and certainly vegetable crops, if the soil forms a tight ball and leaves a wet outline on your hand when you squeeze it, we can delay irrigation until the ball of soil, while still slightly moist and cool to the touch, is dry enough that it begins to crumble at the edges. The depth and time of irrigation should be long enough to fill the entire root zone of the plant, which will be dependent on both the soil texture (Table 1), the level of soil water depletion, and the depth of PAW depletion in the soil profile (Table 2).
Tracking and managing PAW water in the soil is a fundamental acquired skill that serves as a check on the irrigation scheduling methods or any other more sophisticated technologies being used and it remains an extremely valuable skill for anyone managing irrigations. We have many technologies available for irrigation management but a farmer or agronomist’s ability to recognize and understand these relationships and develop the necessary field skills is fundamental to good crop management. Identifying critical points in soil water content and plant growth, such as FC, PAW, and PWP by sampling a soil and making good estimates in the field by watching the crop and noting the various stages in crop development, serve a farmer or agronomist as a good standard and check on any technology being employed for irrigation management.
Farmers and agronomists learn to watch a crop in the field and recognize very subtle changes in leaf color and condition and they can also recognize the crop response and relationship to soil water content. That gives them the capacity to anticipate the optimum timing for the next irrigation. Farmers and agronomists understand these relationships among crop plants, soil water content, and the critical points for irrigation management. Irrigation management is an example of the blending of art and science that goes into good crop management, and it is certainly important in Arizona agriculture.
Leaching
A common question is “how much additional water is needed to accomplish sufficient leaching?”. The objective of leaching is to move sufficient concentrations of soluble down through the soil profile below the rooting depth of the crops being grown, Table 2. That is primarily dependent on the crop and the salinity level of the irrigation water. An effective and straightforward method of calculating a leaching requirement (LR) can be calculated with the following equation that was presented by the USDA Salinity Laboratory (Ayers and Westcot, 1989).
Leaching Requirement (LR) Calculation:
Where:
ECw = salinity of the irrigation water, electrical conductivity (dS/m)
ECe = critical plant salinity tolerance, electrical conductivity (dS/m)
This is a good method of a LR calculation that has been utilized extensively and successfully in Arizona and the desert Southwest for many years. We can easily determine the salinity of our irrigation waters (ECw) and we can find the critical plant salinity tolerance level from easily available tabulations of salinity tolerance for many crops (Ayers and Westcot, 1989). Additional direct references are from Dr. E.V. Maas’ lab at the University of California (Maas, 1984: Maas, 1986; Maas and Grattan, 1999; Maas and Grieve, 1994; and Maas and Hoffman, 1997).
There are many methods to calculate the proper LR and the one shown here (Ayers and Westcot, 1989) is good in my view because it includes the specific salinity limits with the crop and salinity levels of the irrigation water that is being used, and it is very simple and straightforward. For example, we can see in Table 3 from a few selected crops commonly grown in Arizona the variation in salinity tolerance. For a given quality of water (ECe) the LRs calculated from the equation above will increase with lower crop salinity tolerance levels. For example, lettuce will require a higher LR than cotton or barley.
Summary
This article provides a summary of basic irrigation objectives. It is always good to review the basics associated with our crop production systems and that is very true at times like this when we are experiencing critical water shortages in many areas of Arizona, particularly in the Colorado River system. As good stewards of our land and water resources, we continue to strive towards improved efficiencies of irrigation and the production of high yields and high-quality crops.
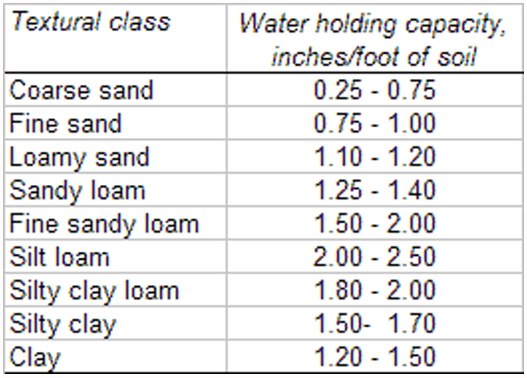
Table 1. Soil texture and water holding capacity.
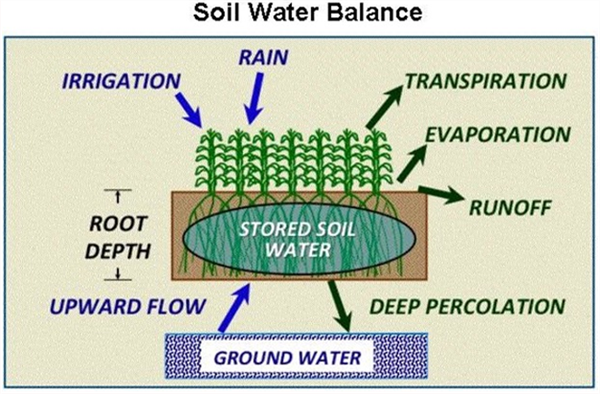
Figure 1. Soil-water balance and plant relationships in a crop production system.
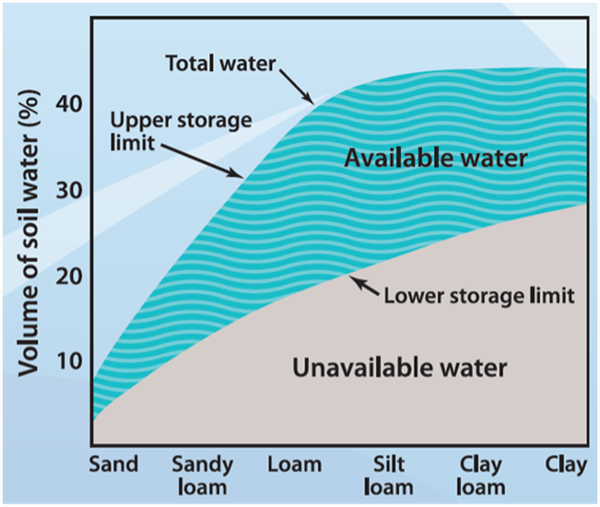
Figure 2. Soil volume, soil texture, and water holding capacity relationships.
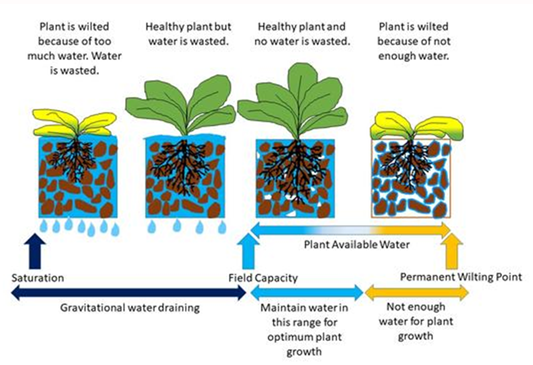
Figure 3. Soil water content relationship to plant-available water.
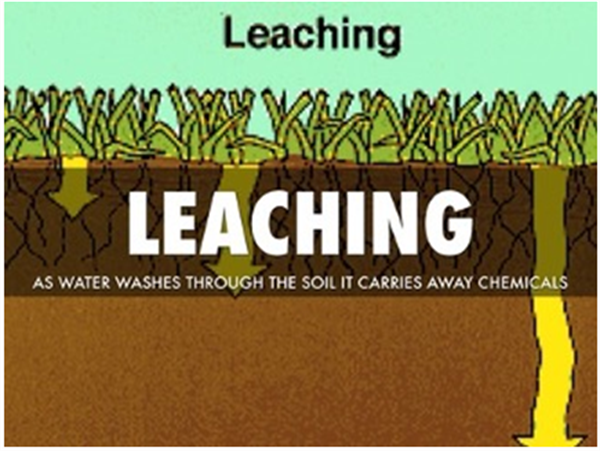
Figure 4. Soil-water leaching process by the movement of gravitational water through a saturated soil.
Table 2. Depths to which the roots of mature crops will deplete the available water supply when grown in a deep permeable, well-drained soil under average conditions.
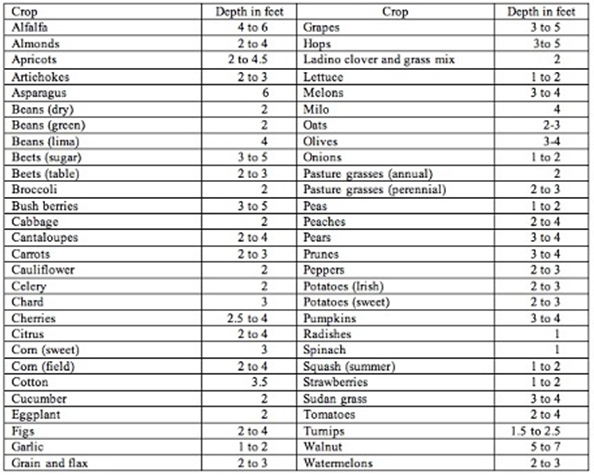
Source: Chapter 11, "Sprinkler Irrigation," Section 15, Natural Resources Conservation
Service National Engineering Handbook
Table 3. Salinity tolerance for selected crops with soil solution salinity levels (ECe, dS/m at 25oC) where yields will be reduced by 10, 25, and 50%.
|
Crop |
10% |
25% |
50% |
|
Lettuce (Latuca sativaL.) |
2 |
3 |
5 |
|
Broccoli (Brassica oleraceaL.) |
4 |
6 |
8 |
|
Cotton (Gossypium hirsutumL.) |
10 |
12 |
16 |
|
Barley (Hordeum vulgareL.) |
12 |
16 |
18 |
Adapted from L. Bernstein, Salt Tolerance of Plants, USDA Bull. 283, 1964 and E.V. Maas, 1984.
References
Allen, R. G., Pereira, L. S., Raes, D., & Smith, M. (1998). Crop evapotranspiration-Guidelines for computing crop water requirements-FAO Irrigation and drainage paper 56. FAO, Rome, 300(9), D05109.
Ayers, R.S. and D.W. Westcot. 1989 (reprinted 1994). Water quality for agriculture. FAO Irrigation and Drainage Paper 29 Rev. 1. ISBN 92-5-102263-1. Food and Agriculture Organization of the United Nations Rome, 1985 © FAO.
https://www.fao.org/3/t0234e/t0234e00.htm
Erie, L.J., O.A French, D.A. Bucks, and K. Harris. 1981. Consumptive Use of Water by Major Crops in the Southwestern United States. United States Department of Agriculture, Conservation Research Report No. 29.
Maas, E.V. 1984. Crop tolerance to salinity. California Agriculture, October 1984. https://calag.ucanr.edu/archive/?type=pdf&article=ca.v038n10p20
Maas, E.V. 1986. Salt tolerance of plants. Appl. Agric. Res., 1, 12-36.
Maas, E.V. and S.R. Grattan. 1999. Crop yields as affected by salinity, Agricultural Drainage, Agronomy Monograph No. 38.
Maas, E. V., and Grattan, S. R. (1999). Crop yields as affected by salinity, agricultural
drainage, Agronomy Monograph No. 38, R. W.
Maas, E. V., and Grieve, C. M. 1994. “Salt tolerance of plants at different growth stages,” in Proc., Int. Conf. Current Developments in Salinity and Drought Tolerance of Plants. January 7–11, 1990, Tando Jam, Pakistan, 181–197.
Maas, E. V., and Hoffman, G. J. (1977). “Crop salt tolerance: Current assessment.”
J. Irrig. Drain. Div. ASCE, 103, 115–134.
This study was conducted at the Yuma Valley Agricultural Center. The soil was a silty clay loam (7-56-37 sand-silt-clay, pH 7.2, O.M. 0.7%). Spinach ‘Meerkat’ was seeded, then sprinkler-irrigated to germinate seed Jan 13, 2025 on beds with 84 in. between bed centers and containing 30 lines of seed per bed. All irrigation water was supplied by sprinkler irrigation. Treatments were replicated four times in a randomized complete block design. Replicate plots consisted of 15 ft lengths of bed separated by 3 ft lengths of nontreated bed. Treatments were applied with a CO2 backpack sprayer that delivered 50 gal/acre at 40 psi to flat-fan nozzles.

Downy mildew (caused by Peronospora farinosa f. sp. spinaciae)was first observed in plots on Mar 5 and final reading was taken on March 6 and March 7, 2025. Spray date for each treatments are listed in excel file with the results.
Disease severity was recorded by determining the percentage of infected leaves present within three 1-ft2areas within each of the four replicate plots per treatment. The number of spinach leaves in a 1-ft2area of bed was approximately 144. The percentage were then changed to 1-10scale, with 1 being 10% infection and 10 being 100% infection.
The data (found in the accompanying Excel file) illustrate the degree of disease reduction obtained by applications of the various tested fungicides. Products that provided most effective control against the disease include Orondis ultra, Zampro, Stargus, Cevya, Eject .Please see table for other treatments with significant disease suppression/control. No phytotoxicity was observed in any of the treatments in this trial.
At the UC Cooperative Extension Automated Technology Field Day in Salinas, CA a couple of weeks ago, several automated technologies were showcased operating in the field for the first time to a general audience. One of the “new” machines designed specifically for in-row weeding in vegetable crops is highlighted here. I’ll discuss other technologies in future articles.
The first is an autonomous robot that uses lasers to kill weeds (Fig. 1a). The machine, developed by Carbon Robotics1, identifies weeds from camera captured images of the bedtop using artificial intelligence techniques. The device is equipped with eight CO2 lasers that emit laser beams roughly 0.25” in diameter in short, < 50 millisecond bursts. As such, it is best suited for controlling small weeds (< 3-4 leaf stage) in high density crops such as baby leaf spinach, spring mix, carrots, and onion. The machine worked well in the demonstration plot, annihilating small weeds, turning plant material into black charcoal (carbon!) and grey ash, and causing significant damage to and potentially killing larger weeds (Fig. 1b).
The percentage of weeds targeted and travel speed (significantly less than 1 mph) of the 80” wide (1 wide bed) machine was comparable to that shown in videos on the company’s website (https://carbonrobotics.com/). The version the company is marketing, however, is a 20’ wide (3 wide beds) tractor pulled implement, and according to sales representatives, has upgrades that increase travel speed. This combination should provide adequate machine productivity (acres/hour).
Company reps reported that the first production units are being delivered to commercial farms presently. Some will be operating in the Yuma area this fall. If interested, I would be more than happy to work with you to help conduct and design experiments for assessing the machine’s performance – % weed control by species, % of weeds targeted, hand weeding labor savings, machine work rate (acres/hour), etc. Please feel free to contact me anytime at siemens@cals.arizona.edu.
____________________
[1] Reference to a product or company is for specific information only and does not endorse or recommend that product or company to the exclusion of others that may be suitable.
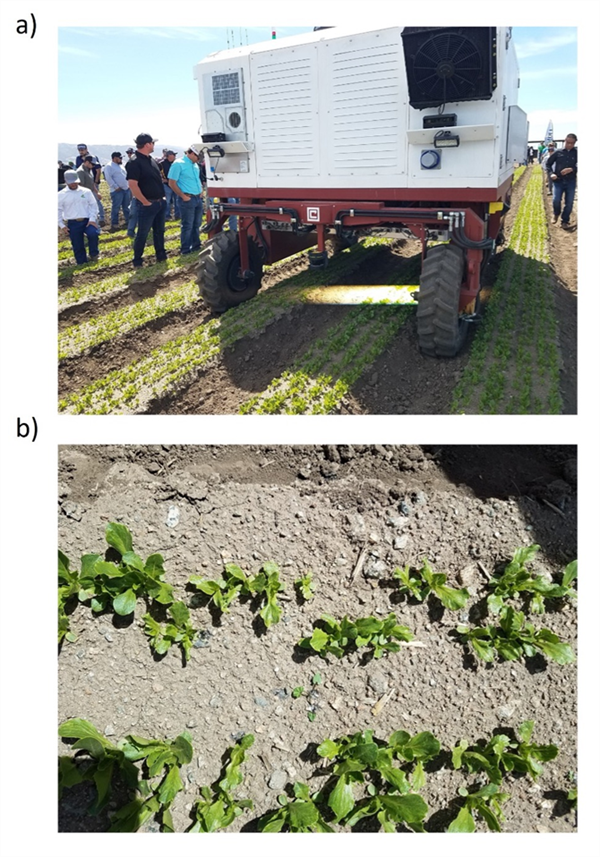
Fig. 1. Autonomous laser weeding machine developed by Carbon Robotics1 a) demonstration at UCCE Automated Technologies Field Day and b) image of bedtop weed control post treatment.
London Rocket (Sisymbrium irio)
If you drive through the Valley of Yuma Arizona this week you will see a significant amount of London rocket, a winter annual broadleaf weed from the family of the Brassicaceae. We can see it in already harvested lettuce fields, edges of alfalfa fields, on roadsides, orchards, and gardens.
Why London Rocket? According to some sources the common name "London rocket" allegedly comes from its abundance after the Great Fire of London in 1666 even though years later Dr E J Salisbury failed to find specimens in a study in 1940 [1].
The seed leaves (cotyledons) are oval, around 2–6 mm long, without pubescence. True leaves are a bit larger than the cotyledon, has smooth edges or a few weak teeth, and is on a long stalk. Leaves are alternate on the stem.
The mature plant grows approximately 24-36” tall in our area. It grows erect and ranches are mostly close to the base of the plant. The leaves have very little pubescence and have opposite lobes. Right now, we can see its abundant yellow flowers in our area and grow in clusters at the top of the stems (pic below). The fruits are 1-1.5” seedpods that are straight or a little curved and about 1mm wide.
Here in the “Lettuce capital of the world” this weed can be a problem because of it is highly competitive.
In lettuce production the application of Kerb (Pronamide) has shown good London rocket control when applied properly. This means not too early or with too much sprinkler irrigation to avoid leaching. Delayed application is often needed, and the location of the herbicide is critical for best performance. Approximately 1-3 days after starting sprinklers for early plantings (Aug-Sep) and from 3-6 days for mid-season plantings (Oct-Nov) [3].
Interestingly, medical researchers tested some extracts of seeds and found it showed significant antipyretic and analgesic effects and antibacterial action [2]. Other medicinal properties have been reported such as the reduction of swelling and use for cleaning of wounds, rheumatism relief, chest congestion, cough, detoxify the liver and spleen [1].
When weeds like London Rocket are infesting our lettuce or alfalfa fields, they can be such a nuisance. But it's possible that in other parts of the world people are looking for them as beneficial herbs.
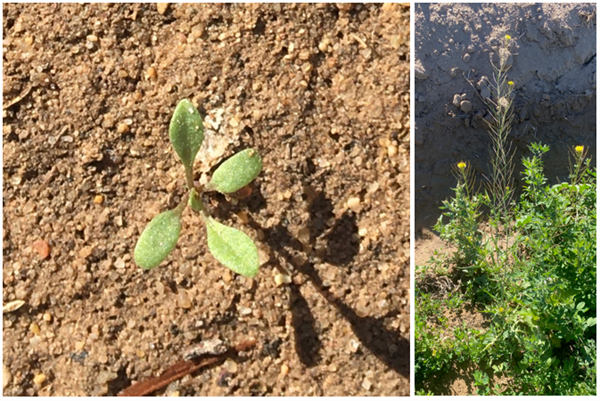
London rocket seedling and mature plant in alfalfa field.
References:
1. Retrieved from: https://en.wikipedia.org/wiki/Sisymbrium_irio
2. Antipyretic, Analgesic and Antimicrobial Studies on Sisymbrium irioS. B. Vohora, S. A. H. Naqvi, I. Kumar (1980) Institute of History of Medicine & Medical Research, Tughlaqabad, New Delhi (India).
3. Retrieved from: https://www.farmprogress.com/timing-critical-kerb-herbicide
Results of pheromone and sticky trap catches can be viewed here.
Corn earworm: CEW moth counts down in all traps over the last month; about average for December.
Beet armyworm: Moth trap counts decreased in all areas in the last 2 weeks but appear to remain active in some areas, and average for this time of the year.
Cabbage looper: Moths increased in the past 2 weeks, and average for this time of the season.
Diamondback moth: Adults increased in several locations last, particularly in the Yuma Valley most traps. Below average for December.
Whitefly: Adult movement remains low in all areas, consistent with previous years
Thrips: Thrips adult movement continues to decline, overall activity below average for December.
Aphids: Winged aphids still actively moving but declined movement in the last 2 weeks. About average for December.
Leafminers: Adult activity down in most locations, below average for this time of season.