
There is a lot of discussion these days regarding the need for crop production systems in Arizona to improve upon the efficiencies of our irrigation systems. The focus on irrigation efficiencies has been accentuated with the current water shortages being experienced in many parts of the state and region, particularly with the Colorado River system.
Despite the focus on irrigation efficiency and the abundance of discussions and advice for the crop production community on how to go about the business of irrigating and producing a crop, very little, if any, comment is being made to define what is meant by “irrigation efficiency”.
There are several ways to define irrigation efficiency. The primary definitions for irrigation efficiency include orientations with water conveyance and delivery systems, agronomic, economic, and environmental efficiencies.
Water Conveyance and Delivery System Efficiency
In the desert Southwest we have the benefit of incredible engineering with the highly developed systems of dams, primary canals, pumps, laterals, and secondary canals that move water from rivers and groundwater supplies to areas of need, which are commonly managed by irrigation districts. Our ability to move water from the original source to the field is a critical aspect of managing water resources and there is an “efficiency” consideration in terms of how water is conveyed from the source to the field. This level of efficiency is largely a function of system engineering and design and the system management.
Agronomic Irrigation Efficiency
Agronomic (crop and soil) considerations are centered on our ability to provide irrigation water for the sustainable production of a crop in the field. The three primary demands for crop water management include: 1) providing water for seed germination and stand establishment, 2) providing irrigation water to match crop-consumptive water use, and 3) sufficient irrigation water to leach soluble salts from the root zone so that the soils can support crop production in a sustainable manner (Figure 1).
Agronomic efficiency at the field level focuses on the crop water demand (CWD) through crop consumptive use (ETc, which is the combination of evaporation and transpiration from the crop) and leaching requirements (LR, which are dependent upon the crop and salinity of the irrigation water).
Agronomic efficiency can be estimated by considering the difference between ETc + LR = CWD and the volume of irrigation water applied (IWA).
Leaching Requirement (LR) can be estimated by use of the following calculation:
Where:
ECw = salinity of the irrigation water, electrical conductivity (dS/m)
ECe = critical plant salinity tolerance, electrical conductivity (dS/m)
This is a good method of a LR calculation that has been utilized extensively and successfully in Arizona and the desert Southwest for many years. We can easily determine the salinity of our irrigation waters (ECw) and we can find the critical plant salinity tolerance level from easily available tabulations of salinity tolerance for many crops (Ayers and Westcot, 1989). Additional direct references are from Dr. E.V. Maas’ lab at the University of California (Maas, 1984: Maas, 1986; Maas and Grattan, 1999; Maas and Grieve, 1994; and Maas and Hoffman, 1997).
Economic Efficiency
Economic efficiency is often considered to be primary factor defining the financial sustainability of a farming operation. Water is a crop input and the costs associated with irrigating a crop includes the cost of the water directly and costs of delivery (pumps, equipment, maintenance, labor, etc.). Economic efficiency essentially considers the “return on the investment” and profitability of irrigating a crop.
Environmental Efficiency
Considerations of irrigation efficiency from an environmental perspective is very broad and encompassing and it can include a combination of efficiencies previously discussed (water conveyance systems, agronomic, and economic considerations). Environmental efficiency is a collective line of consideration regarding overall stewardship of water as a natural resource and beneficial use.
Estimating Field Level Irrigation Efficiencies
The focal point of any irrigation system, from the regional, district, farm, and field levels is to provide water to produce a crop. The crop is the centerpiece of the entire operation. Thus, I believe it is most appropriate to consider irrigation efficiency at the field level in agronomic terms, by use of Equation 1.
We need three factors to estimate field level irrigation efficiency for a crop: 1) crop evapotranspiration (ETc), 2) the crop and field leaching requirement (LR), and 3) a measure of the irrigation water applied to the field in question (IWA).
To determine crop evapotranspiration (ETc) we need a good reference evapotranspiration (ETo) measurement for the field site in question. Reference evapotranspiration (ETo) values multiplied by an appropriate crop coefficient (Kc) can provide very good estimates on actual crop evapotranspiration (ETc) rates as shown in the following equation:
The appropriate Kc values are specific for each crop species and stage of growth. We commonly use crop coefficient Kc values that are provided in the publication “Consumptive Use by Major Crops in the Desert Southwest” by Dr. Leonard Erie and his colleagues, USDA-ARS Conservation Research Report No. 29 and now most commonly from the publication FAO 56 “Crop Evapotranspiration-Guidelines for Computing Crop Water Requirements-FAO Irrigation and Drainage Paper 56” (Allen et al., 1998). Reference information for Kc values can be obtained in these publications for common crops grown in this region.
Example
If we consider an example lettuce crop irrigated with water that has ECw = 1.1 dS/m and the crop water demand (CWD) = 30 inches
Using Equations 1-3, an overall estimate of field level irrigation efficiency can be made. From Equation 2 we can estimate the leaching requirement.
ECw = 1.1 dS/m and ECe (lettuce) = 1.3 dS/m
LR = 1.1 dS/m / (5 X 1.3) – 1.1 = 1.1/5.4 = 0.20 = 20% leaching requirement
LR = 30 X 0.2 = 6.1 ~ 6 inches
Thus, CWD = 30 + 6 = 36 inches total
Assume: 40 inches of irrigation water was applied.
Agronomic efficiency (from Equation 1) = 36/40 = 0.9 = 90% efficiency
Note: If the LR were not included in the total CWD, efficiency would be: 30/40 = 75%
That is an important difference and distinction to understand and demonstrate.
The Arizona Meteorological Network (AZMET) system provides both historical and real-time weather information that can be used to track reference evapotranspiration (ETo) measured at a standardized and properly calibrated weather station site. Reference evapotranspiration values can be obtained daily from AZMET for the nearly 30 sites in Arizona, including the Yuma area and the lower Colorado River Valley. Very importantly, the AZMET is very high quality and the integrity of the system has been constantly managed for over 35 years, first under the direction of Dr. Paul Brown and now with Dr. Jeremy Weiss. This information can be valuable in crop water and irrigation management.
Dr. Jeremy Weiss, program manager for the University of Arizona AZMET system, has recently developed a valuable tool that provides actual crop evapotranspiration (ETc) estimates from several AZMET sites in the lower Colorado River Valley and for several key vegetable crops. Accumulations of ETc values over the previous week are shown based on a date of planting, which is selected by the user. In this model, the Kc values presented in FAO-56 are used for appropriate stages with each crop. The ETo measurements are taken directly from each AZMET site listed.
Dr. Weiss has included the next step with the development of this crop-water management tool that can provide the cumulative crop water use, cumulative ETc, during the growing season for a given crop and planting date for common leafy green vegetable crops in the lower Colorado River areas.
To access this crop-water estimate tool please refer to the following link:
https://viz.datascience.
For example, using lettuce (either iceberg or romaine) and 1 September planting date, we can see from this model that cumulative ETc from 10/5/22 to 10/11/22 is 1.11 inches in the North Gila Valley and 0.94 inches in the Yuma Valley (Figure 2). Cumulative ETc since the planting date is 7.19 and 6.28 inches for these two stations, respectively.
Dr. Weiss and I are working with this model in the field to evaluate and test it. I encourage farmers, agronomists, and field crop managers to review this information and check that against depletion rates of soil plant-available water in the field.

Figure 1. Soil-water balance and plant relationships in a crop production system.
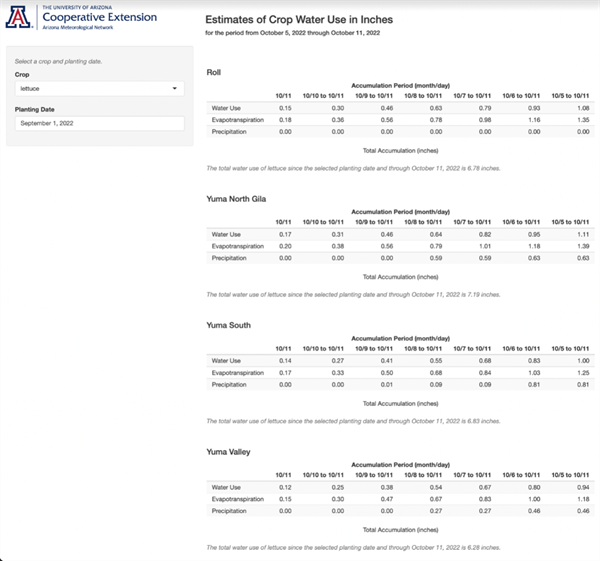
Figure 2. Example of AZMET Crop Water Use estimates for lettuce planted on 1 September 2022 in the lower Colorado River Valley.
References
Allen, R. G., Pereira, L. S., Raes, D., & Smith, M. (1998). Crop evapotranspiration-Guidelines for computing crop water requirements-FAO Irrigation and drainage paper 56. FAO, Rome, 300(9), D05109.
Ayers, R.S. and D.W. Westcot. 1989 (reprinted 1994). Water quality for agriculture. FAO Irrigation and Drainage Paper 29 Rev. 1. ISBN 92-5-102263-1. Food and Agriculture Organization of the United Nations Rome, 1985 © FAO.
https://www.fao.org/3/t0234e/
Erie, L.J., O.A French, D.A. Bucks, and K. Harris. 1981. Consumptive Use of Water by Major Crops in the Southwestern United States. United States Department of Agriculture, Conservation Research Report No. 29.
Maas, E.V. 1984. Crop tolerance to salinity. California Agriculture, October 1984. https://calag.ucanr.edu/
Maas, E.V. 1986. Salt tolerance of plants. Appl. Agric. Res., 1, 12-36.
Maas, E.V. and S.R. Grattan. 1999. Crop yields as affected by salinity, Agricultural Drainage, Agronomy Monograph No. 38.
Maas, E. V., and Grattan, S. R. (1999). Crop yields as affected by salinity, agricultural
drainage, Agronomy Monograph No. 38, R. W.
Maas, E. V., and Grieve, C. M. 1994. “Salt tolerance of plants at different growth stages,” in Proc., Int. Conf. Current Developments in Salinity and Drought Tolerance of Plants. January 7–11, 1990, Tando Jam, Pakistan, 181–197.
Maas, E. V., and Hoffman, G. J. (1977). “Crop salt tolerance: Current assessment.”
I hope you are frolicking in the fields of wildflowers picking the prettiest bugs.
I was scheduled to interview for plant pathologist position at Yuma on October 18, 2019. Few weeks before that date, I emailed Dr. Palumbo asking about the agriculture system in Yuma and what will be expected of me. He sent me every information that one can think of, which at the time I thought oh how nice!
When I started the position here and saw how much he does and how much busy he stays, I was eternally grateful of the time he took to provide me all the information, especially to someone he did not know at all.
Fast forward to first month at my job someone told me that the community wants me to be the Palumbo of Plant Pathology and I remember thinking what a big thing to ask..
He was my next-door mentor, and I would stop by with questions all the time especially after passing of my predecessor Dr. Matheron. Dr. Palumbo was always there to answer any question, gave me that little boost I needed, a little courage to write that email I needed to write, a rigid answer to stand my ground if needed. And not to mention the plant diagnosis. When the submitted samples did not look like a pathogen, taking samples to his office where he would look for insects with his little handheld lenses was one of my favorite times.
I also got to work with him in couple of projects, and he would tell me “call me John”. Uhh no, that was never going to happen.. until my last interaction with him, I would fluster when I talked to him, I would get nervous to have one of my idols listening to ME? Most times, I would forget what I was going to ask but at the same time be incredibly flabbergasted by the fact that I get to work next to this legend of a man, and get his opinions about pest management. Though I really did not like giving talks after him, as honestly, I would have nothing to offer after he has talked. Every time he waved at me in a meeting, I would blush and keep smiling for minutes, and I always knew I will forever be a fangirl..
Until we meet again.
Interested in staying up to date on the latest international robotic ag technologies? FIRA (International Forum for Agricultural Robotics) held an “Open Day” May 13th and posted recorded presentations on their website. In addition to technical panel discussions with industry experts, the event included live field demos of weeding, scouting and general farming robots. The FIRA Connect website also has replays of presentations given at the 2021 FIRA Conference held last December. In total, there are thirty short presentations and field demos of ag robots freely available. About 1/3rd of the presentations/demos are weeding machines from Europe that utilize various methods for in-row weed removal – lasers, precision spot sprayers, concentrated light beams, and mechanical devices including knife blades, rotating heads, and weed pulling mechanisms. The site also provides links to a “Robot Wall” and a “R&D Wall” where companies have posted information about their commercially available and in-development ag robots. It is a quality website and worth checking out to learn more about the latest automated agricultural technology innovations being developed around the world.
To connect to the FIRA website, click here
The purpose of the survey is to provide information to help you make weed management decisions and will include weed species, location, and infestation level monitored monthly. Twenty four points have been marked for sampling. They are distributed from San Luis to Texas Hill and includes the Yuma Mesa. A three to five acre radius will be surveyed around each point and will be reported on an aerial photograph of the county. A separate map will be provided for the abundant weed species.
It is well known that weeds can be reservoirs for insect pests such as western flower thrips sweetpotato whitefly and for insect-transmitted viruses like Cucurbit Yellow Stunting Disease Virus (CYSDV) or Inpatiens Necrotic Spot Virus (INSV). It is our hope that the survey data aids in identifying concentrations of the weeds that could serve as hosts and are possible sources of infection.
The scale used on this survey for the infestation level on each weed is color coded as follows:
|
Color Code |
Infestation Level |
Plants / acre |
|
White |
ND: Not Detected |
0 |
|
Blue |
P: Present |
1-3 pl/ac |
|
Yellow |
L: Low |
4-50 pl/ac |
|
Orange |
M: Medium |
51-200 pl/a |
|
Red |
H: High |
Above 200 pl/ac |
We are reporting a couple of the most abundant weeds in this update. Additional Yuma county weed maps will be uploaded reported in future updates.
The next image contains the location of our 24 sampling points:
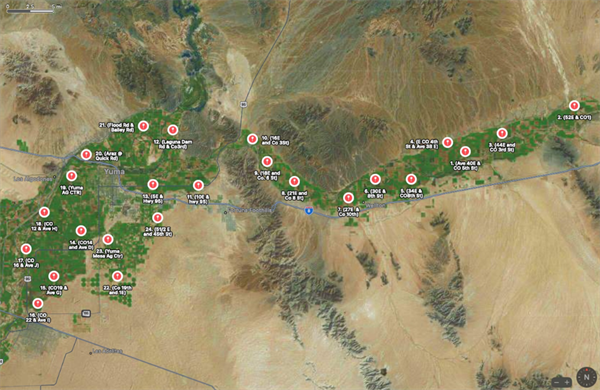
Figure 1. Location of areas surveyed
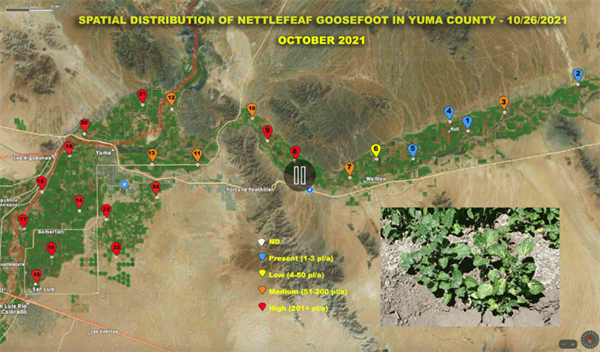
Figure 2. Nettle leaf goosefoot continues to be the most abundant weed
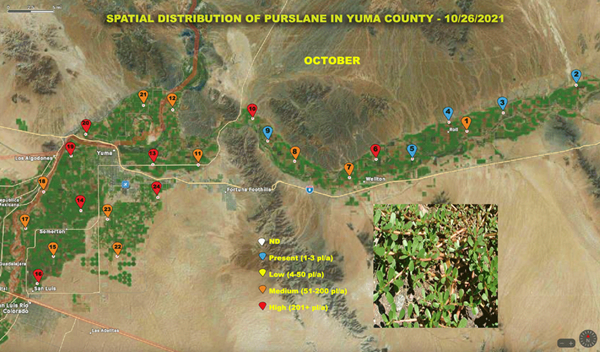
Figure 3. Purslane has been present year round around ditches and citrus orchards and alfalfa fields. With recent temperatures it is increasingly easier to detect it in our sampling points at the Yuma Valley.
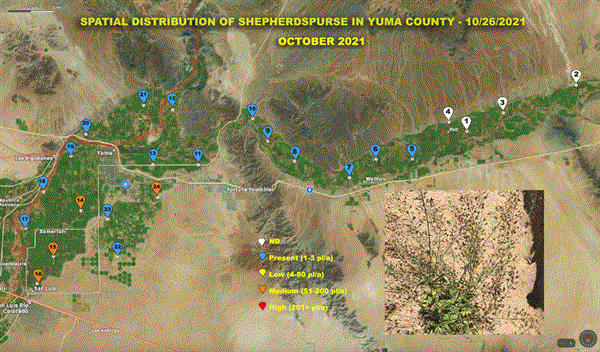
Figure 4. Shepherdspurse distribution up to February