The water shortage on the Colorado River that we are dealing with today has been accelerated by the extensive drought that began more than 20 years ago. Climatologists have recognized this drought, extending more than 22 years, as the most extensive drought this region has experienced in more 1,200 years. However, there are many factors that have been in operation for more than 100 years that are contributing significantly to our current water shortage dilemma.
To effectively address a problem, it is important to understand the situation leading to the problem in question and that includes understanding the derivation and historical background leading to the current condition. Accordingly, I am offering a few points of historical importance in my view that have contributed to the development of the challenges we are dealing with on the Colorado River system today.
The Colorado River watershed and system (Figure 1) is one of the largest in the U.S. The main channel of the Colorado River extends over 1,450 miles, covers 244,000 square miles in the drainage basin, and it has the greatest elevation fall of any watershed in North America. The Colorado River supports more than 40M people, nearly 6M acres of cropland, 30 native American tribes, and provides large amounts of electrical power generation for southwestern U.S.

Figure 1. The Colorado River watershed. Source: USGS.
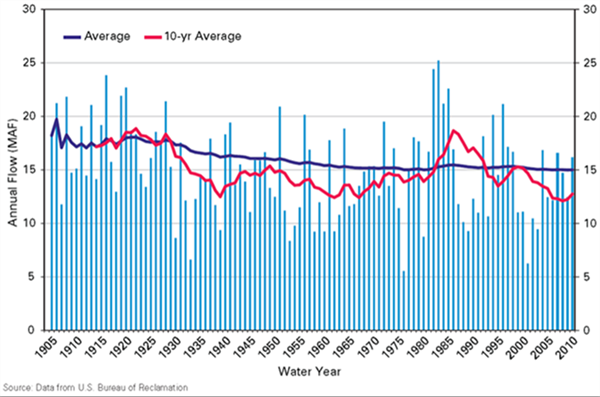
Average annual flow in the Colorado River between 1906-2017 was 14.8 million acre-feet (maf), Figure 2. Between 2000 and 2018, the average annual flow has been ~ 12.4 maf, Figure 3. The allocated water for diversion on the Colorado River has been 16.5 maf (15 maf in the U.S. + 1.5 maf to Mexico). Thus, there has been a structural deficit of at least 2.0 maf for many years and during this megadrought of the early 21st century we have been operating on a deficit of ~ 4.0 maf.
Actual water use estimates for the past 30-40 years are shown in Table 1, including evaporation and actual diversions, so that the total use of the Colorado River has been estimated at ~ 16.0-17.5 maf. Collectively, as a result over the past 22 years, the great reservoirs of Lakes Mead and Powell have been significantly diminished.

Figure 2. Colorado River Annual Flow, 1905-2010 with an overall average and 10-year
average. Source: Bureau of Reclamation.

Figure 3. Colorado River Annual Flow, 1905-2020 with an overall average and 2-year
average. Source: Bureau of Reclamation.
|
Colorado River Basin Section |
MAF |
MAF |
|
|
Min |
Max |
|
Upper Basin mainstream uses (includes evaporation) |
4.0 |
4.5 |
|
Lower Basin mainstream uses |
7.5 |
7.5 |
|
Lower Basin reservoir evaporation |
1.0 |
1.5 |
|
Lower Basin tributaries |
2.0 |
2.5 |
|
Total Lower Basin |
10.5 |
11.5 |
|
Subtotal (U.S.) |
14.5 |
16.0 |
|
Mexico |
1.5 |
1.5 |
|
TOTAL |
16.0 |
17.5 |
Table 1. Colorado River Use Estimates. Source: Bureau of Reclamation.
MAF = million acre-feet per year.
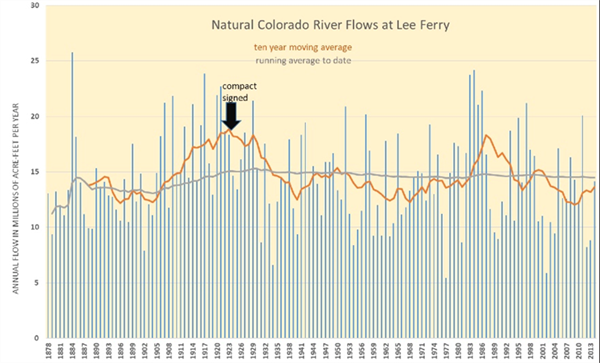
One observation that can be drawn from a review of Figures 2-4 is that annual flow in the Colorado River is highly variable. Secondly, the past 20 years indicates a distinct decline in annual flow in the river. Comparatively, the first 20 years of the 20th century had relatively high annual flows, particularly in contrast to the first 20 years of the 21stcentury. This has contributed to the difficulties being experienced today.
Governance of the Colorado River is commonly referenced to the “Law of the River”, which is based on the Colorado River Compact of 1922 (CRC of 1922) and a collection of laws, contracts, agreements, and definitions. Thus, the Law of the River is not one distinct entity but rather an amalgam of various components. Key components include the CRC of 1922 which was formally negotiated among the basin states to define how much water from the Colorado River can be used by each state on an annual basis. Other agreements contribute to the aggregate Law of the River, including a 1944 Treaty, that agreed to Colorado River water allocations to Mexico. In 2007, basin states negotiated interim guidelines to deal with Colorado River water shortages and determine the reductions for each state depending on the elevation of water in Lake Mead. The reductions associated with a shortage of Colorado River water was further augmented in 2019 by the Drought Contingency Plan (DCP) among the basin states, with specific guidelines for both the upper and lower-basin states.
The CRC of 1922 is a foundation to the “Law of the River” and was developed following a period of relatively high annual flows, Figure 4. Based on the records associated with the transactions leading to the signing of the CRC of 1922, the hydrologists and other scientists were providing data and interpretations to the commission that was working on the CRC of 1922. Even though these hydrologists and scientists did not have the technological capabilities that are available today, they did an amazingly good job. There is evidence that the data was presented to commission negotiators showing that allocating 16 maf (plus the future allocation to Mexico for delivery) was more than the 10 year-average for much of the timespan of the available data. Nevertheless, the operational base of Colorado River water allocation was defined in the CRC of 1922 with 15 maf allocated among the basin states and they have been able to make it work for 100 years. However, as we can see from review of Figures 2-4 and considering the annual average flow of the past 20 years being ~ 12.4 maf, the original CRC of 1922 allocation budget is not sustainable.

Figure 4. Natural annual Colorado River flow data from 1878-2013 with a running average
(gray line) and 10-year moving average (orange line) and indicating the point of CRC of 1922 signing.
The good news is that we do have ~ 12 maf of annual flow currently to work with. That represents about 27% less annual flow than the budgeted amount of 16.5 maf. If all states receiving Colorado River water allocations were proportionately reduced by 27%, each state would then need to determine how that water would be allocated within their boundaries. Arizona’s allocation would change from 2.8 to ~ 2 maf.
One of the good things about common attitudes for people in agriculture is the tendency to appreciate and deal with reality and the basic facts that we are faced with. Whatever we do, we must deal with the reality of this situation on the Colorado River and come to terms with the facts of the matter the best we can. Agriculture is responsible for ~ 70% of the total water diversions in Arizona which supports an industry worth more than $23B annually and provides food and fiber to the state, region, nation, and global exports.
Some experts are advocating a review and re-negotiation of the CRC of 1922 and the basic budget of water allocations. That is a reasonable suggestion considering the facts of the case.
The climate is bearing down upon us, conditions on the Colorado River are increasingly dire, and we do not have much time to act. In agriculture, we need to be part of the process of dealing with the Colorado River water shortage and be part of the solution in a manner that is sustainable for all of Arizona and the productive agricultural systems of this state and region.
I hope you are frolicking in the fields of wildflowers picking the prettiest bugs.
I was scheduled to interview for plant pathologist position at Yuma on October 18, 2019. Few weeks before that date, I emailed Dr. Palumbo asking about the agriculture system in Yuma and what will be expected of me. He sent me every information that one can think of, which at the time I thought oh how nice!
When I started the position here and saw how much he does and how much busy he stays, I was eternally grateful of the time he took to provide me all the information, especially to someone he did not know at all.
Fast forward to first month at my job someone told me that the community wants me to be the Palumbo of Plant Pathology and I remember thinking what a big thing to ask..
He was my next-door mentor, and I would stop by with questions all the time especially after passing of my predecessor Dr. Matheron. Dr. Palumbo was always there to answer any question, gave me that little boost I needed, a little courage to write that email I needed to write, a rigid answer to stand my ground if needed. And not to mention the plant diagnosis. When the submitted samples did not look like a pathogen, taking samples to his office where he would look for insects with his little handheld lenses was one of my favorite times.
I also got to work with him in couple of projects, and he would tell me “call me John”. Uhh no, that was never going to happen.. until my last interaction with him, I would fluster when I talked to him, I would get nervous to have one of my idols listening to ME? Most times, I would forget what I was going to ask but at the same time be incredibly flabbergasted by the fact that I get to work next to this legend of a man, and get his opinions about pest management. Though I really did not like giving talks after him, as honestly, I would have nothing to offer after he has talked. Every time he waved at me in a meeting, I would blush and keep smiling for minutes, and I always knew I will forever be a fangirl..
Until we meet again.
Vol. 13, Issue 1, Published 1/12/2022
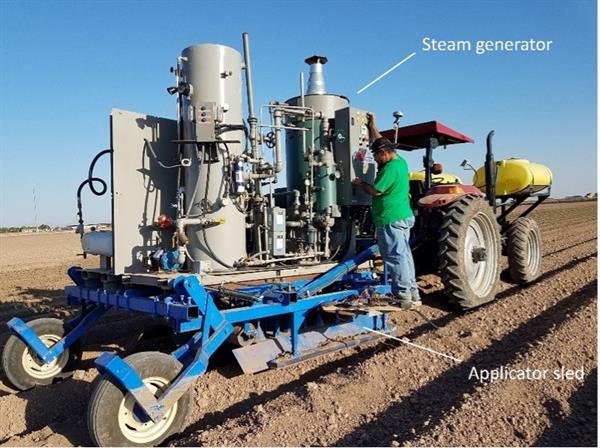
Last fall, we established two trials investigating the used of band-steam to control Fusarium wilt of lettuce. We utilized the prototype band-steam applicator (Fig 1) described in previous UA Veg IPM articles (Vol. 11 (15) to inject steam into the soil prior to planting. The concept behind band-steam is to disinfest narrow bands of soil using high temperature steam. In the trials, the steam applicator was configured to treat a 4” wide by 4” deep band of soil centered on the seedline.
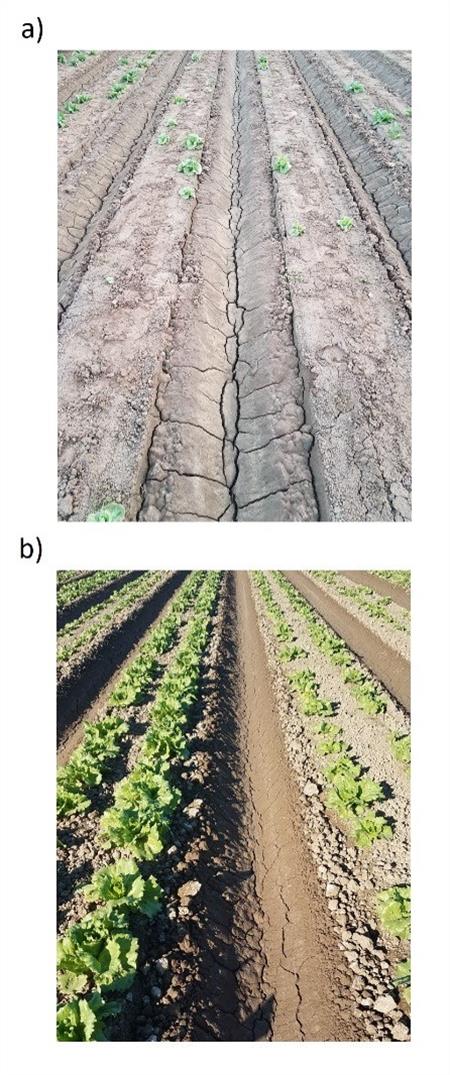
Experiment results were mixed. At the field site where Fusarium inoculum loads were high, band-steam provided no benefit with virtually all lettuce plants succumbing to the disease (Fig 2a). However, at the trial site where Fusarium inoculum levels were moderate, disease incidence was reduced by more than 40%, and plants appeared to be healthier and more vigorous (Fig. 2b). We’ll be harvesting these plots soon so stay tuned to learn whether these differences translate into significant yield increases.
If you are interested in trying band-steam on your farm, please let me know. We are in the process of constructing a second-generation band-steam applicator that has a higher capacity steam generator and simpler design than our first prototype and are seeking collaborators.
Acknowledgements
This work is partially funded by the Arizona Specialty Crop Block Grant Program
A special thank you is extended to Larry Ott and Gila Valley Farms for allowing us to conduct this research on their farm.

Fig. 1. Band-steam applicator principally comprising a 35 BHP steam generator mounted on a bed-shaper applicator sled.

Fig. 2. Lettuce seedlings at field sites with (a) very high and (b) moderate levels of Fusarium wilt of lettuce inoculum. Band-steam (left) and untreated (right) plots are shown.
An increasingly diverse number of minor acreage specialty crops are grown in this region every year. Managing some of these crops can be difficult without local experience. It is helpful to at least know what botanical family they belong to because crops in the same family often have similar growth habits, pest problems and fertility requirements. There are almost no pesticides registered for some of these crops because of the limited acreage, but response to pesticides is often, but not always, similar to that of other crops in the same family. Knowing the family they are in can often give you an idea of what to expect. Kerb, for instance, is generally safe to crops in the Composite family (Lettuce, artichokes, radicchio) but is harmful to crops in the brassica family (Broccoli, cabbage, bok choy). The following chart lists crops by botanical family.
Crop Families
|
Botanical name |
Common name |
Crops |
|
Asteraceae |
Composite or Sunflower |
Lettuce, endive, radicchio, artichokes, echina, sunflower, salsify, chrysanthemum, stevia, scorzonera, romaine, cardoon, burdock |
|
Cruciferae |
Brassica or mustard |
Broccoli, arugula, mizuna, horseradish, cress, bok choy, cauliflower, collards, kale, kohlrabi, radish, rapini, tot soi, cabbage, rutabaga, brussel sprouts, canola, Chinese cabbage, mustard greens, rape, turnip |
|
Umbelliferae |
Carrot |
Carrot, dill, celery, cilantro, fennel, parsley, parsnip, celeriac, angelica |
|
Chenopodium or Amaranthus |
Goosefoot |
Spinach, chard, beets, amaranth, epazoloe, sugar beets |
|
Allaceae |
Lily or onion |
Asparagus, garlic, onion, leek, shallots ,scallion, cipollini |
|
Cucubitacea |
Melon |
Melons, pumpkin, cucumber, squash, gourd, zucchini |
|
Solanaceae |
Nightshade |
Tomato, potato, peppers, eggplant, tobacco, tomatillo, petunia |
|
Malvaceae |
Mallow |
Okra, cacoa, jute, hibiscus |
|
Polygonacea |
Knotweed |
Rhubarb, sorrel, buckwheat, dock |
|
Lamiaceae |
Mint |
Basil, mint, shiso, sage, marjoram, oregano, hyssop, savoy, thyme, stachsy |
|
Leguminosae |
Bean |
Peas, beans, lentils, alfalfa, clover, lupin, soy beans, peanut, garbanzo, cowpea, vetch |
|
Gramineae |
Grass |
Wheat, barley, corn, rice, sugar cane, oats, sorghum, lemon grass, sudan, millet, rye |