
Arizona agriculture utilizes ~ 70% of the water in this state and generates a strong and productive industry. Arizona agriculture generates more than $23B in sales as well as directly and indirectly supporting more than 138,000 Arizona jobs and employing more than 162,000 unique workers. Arizona ranks among leading states in the production of lettuce, spinach, broccoli, cauliflower, cantaloupe, honeydew melons, durum wheat, and other commodities. Arizona is an important area for the seed production of many crops that are used across the U.S. and worldwide. Many Arizona counties rank in the top 1% of all U.S. counties in terms of crop and livestock production (Murphree, 2018).
In response to the Colorado River (CR) water shortage and the current reductions in CR allocations to Arizona via the Central Arizona Project (CAP), which is primarily impacting agricultural irrigation districts in central Arizona, there is an increasing level of scrutiny on agricultural uses of Arizona water. This of course is accentuated with the recognition that agriculture utilizes ~ 70% of the Arizona water supply.
In the irrigation districts along the mainstem of the CR, there is a common adage of “First in use, first in right.” This is a fundamental aspect of the “law of the river”, which is an amalgam of the various laws, agreements, and rulings on the governance of CR water. Therefore, it is important for us to consider and prepare the positive case that can be made for the good stewardship of water resources provided by Arizona agriculture.
One common area of criticism that is directed towards Arizona crop production systems, is the use of surface and flood irrigation systems. The alternative irrigation methods that are commonly advocated for use instead of flood irrigation are methods such as drip irrigation, micro-irrigation systems, sprinklers, etc. Each of these are good irrigation methods and advantageous under the appropriate conditions. However, a good case can be made for the very efficient use of flood irrigation systems, particularly with high-flow turnouts and dead level (or very nearly so) basins for irrigation. When properly managed, these types of flood irrigation systems can be very efficient.
When we know the area to be irrigated, the flow rate of water in the irrigation delivery ditch, and the amount of water needed; then we can determine the proper time or duration for an irrigation event. If we can get fast and uniform coverage of the field to be irrigated, apply the proper volume of water to replenish the plant-available water supply to the soil, then cut off the flow of irrigation water into the field; we can do a very good job of delivery for high water-use efficiency.
To facilitate the process of managing individual irrigations for optimum efficiency, the Irrigator’s Equation can be used to estimate the depth of water applied or time (duration) of an irrigation event.
Q x t = d x A
Where: Q = the flow rate, in cubic feet per second (cfs);
t = the set time or total time of irrigation (hours);
d = the depth of water applied (inches) and
A = the area irrigated (acres).
With an understanding of the dominant soil type in the field being irrigated and the level of soil-water depletion at the time of irrigation, we can estimate the amount or depth of water needed to replenish the soil profile of plant-available water to support the crop and prevent water stress.
In managing crop fields and irrigations, we recognize that soil textures vary in terms of water holding capacities and it is important to understand the dominant soil textures in the field, not only on the surface but also through the depths of the soil profile through the effective rooting depth of the crop, Tables 1 & 2.
Collectively, we can manage surface or flood irrigation systems efficiently. In the crop production arena, it is important to communicate these points effectively.
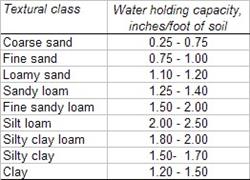
Table 1. Soil texture and water holding capacity.
2. Depths to which the roots of mature crops will deplete the available water supply when grown in a deep permeable, well-drained soil under average conditions.
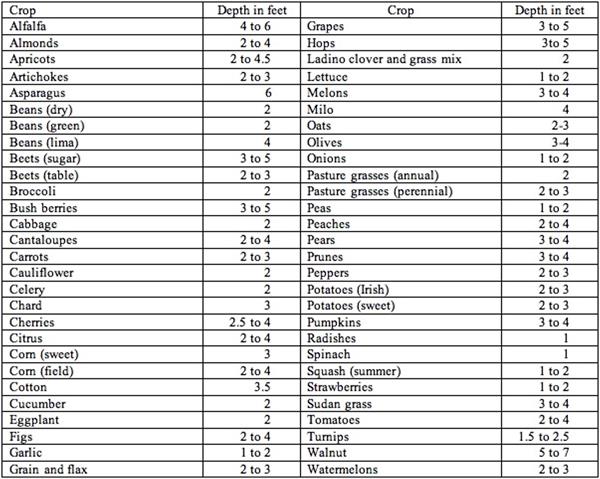
Source: Chapter 11, "Sprinkler Irrigation," Section 15, Natural Resources Conservation Service National Engineering Handbook
References:
Murphree, J. 2018. Arizona Agriculture is 23 Billion Dollars Beautiful, Arizona Farm Bureau.
https://www.azfb.org/Article/Arizona-Agriculture-is-23-Billion-Dollars-Beautiful
Hi, I’m Chris, and I’m thrilled to be stepping into the role of extension associate for plant pathology through The University of Arizona Cooperative Extension in Yuma County. I recently earned my Ph.D. in plant pathology from Purdue University in Indiana where my research focused on soybean seedling disease caused by Fusarium and Pythium. There, I discovered and characterized some of the first genetic resources available for improving innate host resistance and genetic control to two major pathogens causing this disease in soybean across the Midwest.
I was originally born and raised in Phoenix, so coming back to Arizona and getting the chance to apply my education while helping the community I was shaped by is a dream come true. I have a passion for plant disease research, especially when it comes to exploring how plant-pathogen interactions and genetics can be used to develop practical, empirically based disease control strategies. Let’s face it, fungicide resistance continues to emerge, yesterday’s resistant varieties grow more vulnerable every season, and the battle against plant pathogens in our fields is ongoing. But I firmly believe that when the enemy evolves, so can we.
To that end I am proud to be establishing my research program in Yuma where I will remain dedicated to improving the agricultural community’s disease management options and tackling crop health challenges. I am based out of the Yuma Agricultural Center and will continue to run the plant health diagnostic clinic located there.
Please drop off or send disease samples for diagnosis to:
Yuma Plant Health Clinic
6425 W 8th Street
Yuma, AZ 85364
If you are shipping samples, please remember to include the USDA APHIS permit for moving plant samples.
You can contact me at:
Email: cdetranaltes@arizona.edu
Cell: 602-689-7328
Office: 928-782-5879
It’s September and planting season is underway. When planting lettuce, uniform seed spacing is critical for efficient, economical crop thinning. Seedlings spaced too close together, commonly referred to as “doubles”, are difficult and time consuming to remove by hand. Automated thinning machines which intermittently deliver an herbicidal solution to thin excessive plants often consider doubles as a single plant. In such instances, both seedlings are left in the field (Fig. 1). This results in increased labor costs during the subsequent hand weeding operation where weeds and doubles are removed.
Several years ago, we conducted trials examining the influence of planter travel speed on seed spacing uniformity (Siemens and Gayler, 2016). In the study, a Stanhay 785 Singulaire vacuum planter was tested at travel speeds of 1.0, 1.5, 2.0 and 2.5 mph on shaped beds at the Yuma Agricultural Center. The results showed that the percentage of “difficult to thin” spacings, defined as doubles and seeds spaced less than 1 1/8” apart, increased from about 5% to 10% as speed increased from 1.0 mph to 2.5 mph (Fig. 2) . Similarly, the percentage of seeds “precisely placed” within 0.5” of the target location (i.e., 2.0 ± 0.5”) decreased from 70% to less than 45%, and the percentage of skips increased from 7% to 30%. Variability of seed spacing uniformity as measured by the coefficient of variation (COV) of seed spacings also increased. In short, planter travel speed had a significant effect on seed spacing uniformity and doubles - the higher the speed, the poorer the performance.
You may be asking what is the reason for the phenomenon observed? A logical explanation is that seeds are traveling at the speed of the planter when they are released and tend to “bounce and roll” in the direction of travel when they hit the soil surface. Thus, the higher the travel speed, the further seeds bounce and roll resulting in increased seed spacing variability. Other factors such as bed condition (i.e., cloddy vs well tilled) can also affect the amount of bounce and roll and cause poor seed placement and closely spaced seedlings that are difficult to thin (Fig. 3).
If you would like more information on how to accurately assess and analyze planter performance or are interested in conducting trials to determine how planter speed is affecting the percentage of doubles in your field conditions, please feel free to contact me.
References
Siemens, M.C., & Gayler, R.R. (2016). Improving seed spacing uniformity of precision vegetable planters. Appl. Eng. Agric., 32(5), 579-587.

Fig. 1. Lettuce seedlings intermittingly sprayed with an herbicidal solution by
automated thinning machine for purpose of thinning excess seedlings. Examples
of closely spaced seedlings, “doubles”, that are not sprayed and must be
subsequently thinned by hand (circled).
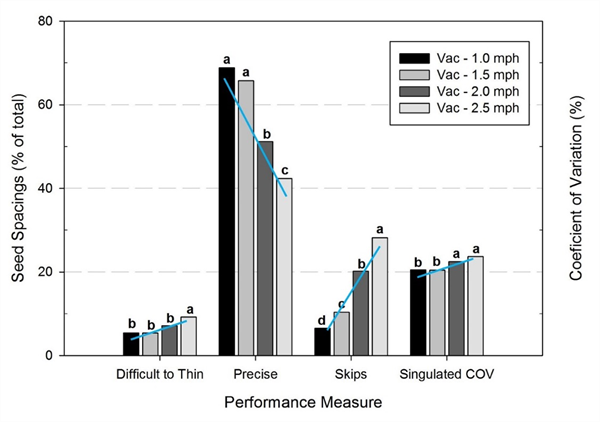
Fig. 2. Seeding performance of a vegetable planter sowing lettuce when
operated at four travel speeds.
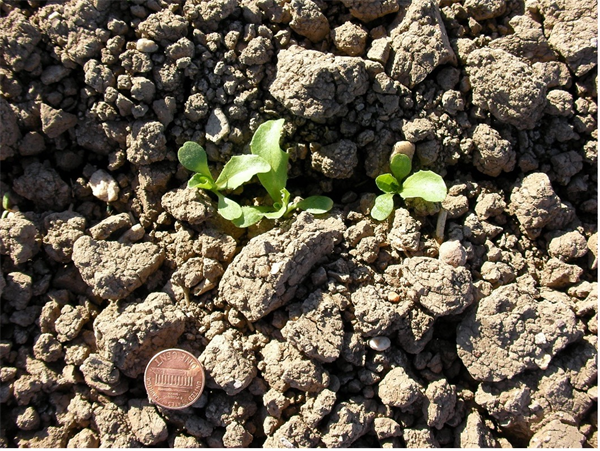
Fig. 3. Poor seed spacing uniformity, possibly due to cloddy soil
conditions causing excessive seed bounce and roll.
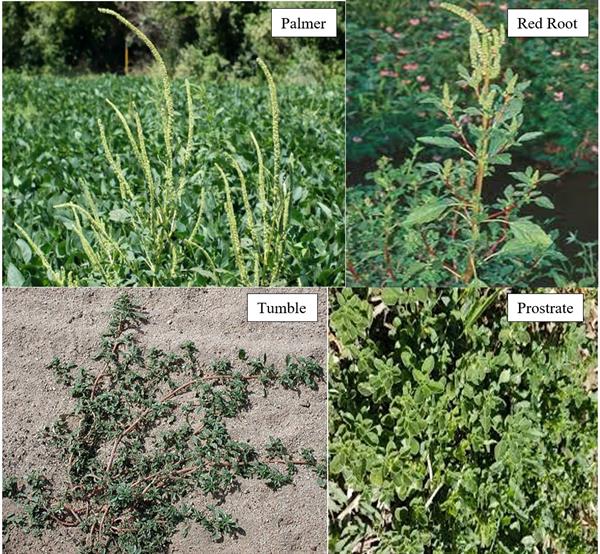
Pigweed Identification
Pigweeds are some of the most common summer annual broadleaf weeds in the low deserts. Although they are often lumped together, there are 4 different species of pigweed that are common here and more than 10 species that occur as weeds in California and Arizona. Their growth habits and response to herbicides are similar. It is easy to identify them by physical characteristics but one species of pigweed can hybridize with another and become less distinguishable.
Palmer Amaranth (Amaranthus palmeri) is probably the most common pigweed species found in this region. It is very aggressive and fast growing and can become 6 feet tall or higher if uncontrolled. It has one thick stem and several lateral branches. The leaves are lance shaped, hairless and have distinctive white veins on the underside. It has flowering tassels that become stiff and spiny. This species has become resistant to Glyphosate in many parts of the county.
Redroot Pigweed (Amaranthus retroflexus) is probably the second most common pigweed species. It is shorter and the seed heads are smaller, in clusters and have stiff spine-like scales. It has leaf hairs on the margins and the veins are often reddish. The lower stems are often reddish. This species will hybridize with Palmer Amaranth and become less distinguishable.
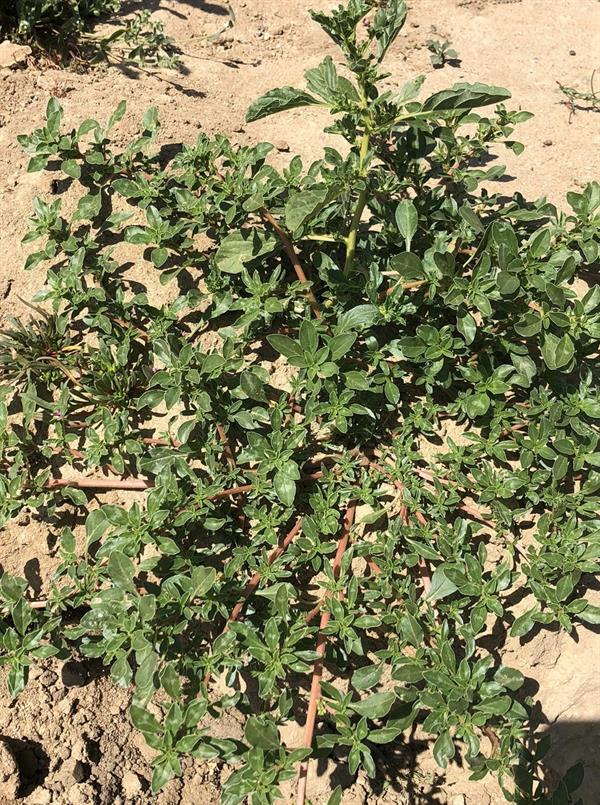
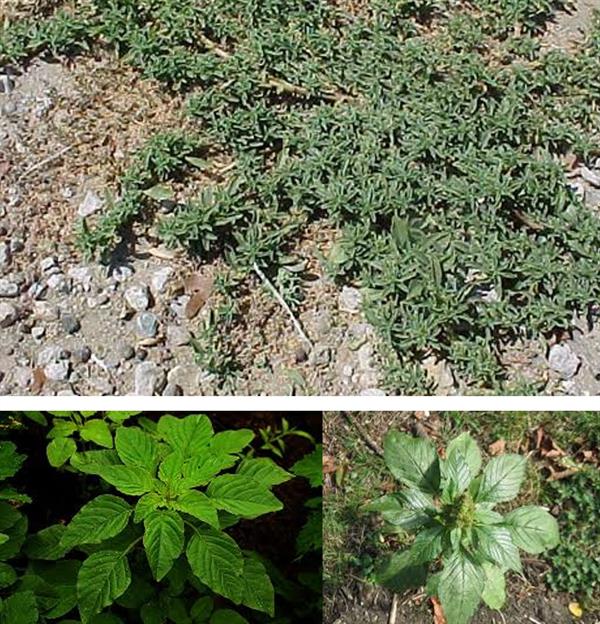
Tumble Pigweed (Amaranthus albus) is very different from Palmers or Redroot. It grows lower to the ground and has many branches that turn upright. The leaves are much smaller and narrower. The numerous stems are light green rather than red. The seed heads are small, spiny and at the base of the leaves rather than in long terminal spikes. When mature, the branches are sticky, stiff bristles that break off at the ground and tumble with the wind.
Prostrate Pigweed (Amaranthus blitoides) is very similar to Tumble Pigweed but the stems are more prostrate, grow close to the ground and form mats. The stems and leaves are smaller and reddish rather than light green.
This time of year, John would often highlight Lepidopteran pests in the field and remind us of the importance of rotating insecticide modes of action. With worm pressure present in local crops, it’s a good time to revisit resistance management practices and ensure we’re protecting the effectiveness of these tools for seasons to come. For detailed guidelines, see Insecticide Resistance Management for Beet Armyworm, Cabbage Looper, and Diamondback Moth in Desert Produce Crops .
VegIPM Update Vol. 16, Num. 20
Oct. 1, 2025
Results of pheromone and sticky trap catches below!!
Corn earworm: CEW moth counts declined across all traps from last collection; average for this time of year.
Beet armyworm: BAW moth increased over the last two weeks; below average for this early produce season.
Cabbage looper: Cabbage looper counts increased in the last two collections; below average for mid-late September.
Diamondback moth: a few DBM moths were caught in the traps; consistent with previous years.
Whitefly: Adult movement decreased in most locations over the last two weeks, about average for this time of year.
Thrips: Thrips adult activity increased over the last two collections, typical for late September.
Aphids: Aphid movement absent so far; anticipate activity to pick up when winds begin blowing from N-NW.
Leafminers: Adult activity increased over the last two weeks, about average for this time of year.


