The purpose of the survey is to provide information to help you make weed management decisions and will include weed species, location, and infestation level monitored monthly. Twenty four points have been marked for sampling. They are distributed from San Luis to Texas Hill and includes the Yuma Mesa. A three to five acre radius will be surveyed around each point and will be reported on an aerial photograph of the county. A separate map will be provided for the abundant weed species.
It is well known that weeds can be reservoirs for insect pests such as western flower thrips sweetpotato whitefly and for insect-transmitted viruses like Cucurbit Yellow Stunting Disease Virus (CYSDV) or Inpatiens Necrotic Spot Virus (INSV). It is our hope that the survey data aids in identifying concentrations of the weeds that could serve as hosts and are possible sources of infection.
The scale used on this survey for the infestation level on each weed is color coded as follows:
|
Color Code |
Infestation Level |
Plants / acre |
|
White |
ND: Not Detected |
0 |
|
Blue |
P: Present |
1-3 pl/ac |
|
Yellow |
L: Low |
4-50 pl/ac |
|
Orange |
M: Medium |
51-200 pl/a |
|
Red |
H: High |
Above 200 pl/ac |
We are reporting a couple of the most abundant weeds in this update. Additional Yuma county weed maps will be uploaded reported in future updates.
The next image contains the location of our 24 sampling points:
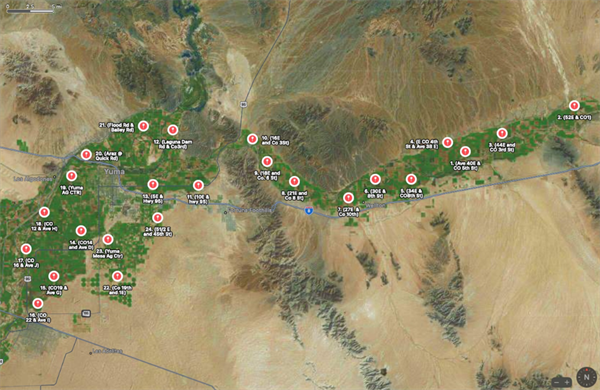
Figure 1. Location of areas surveyed
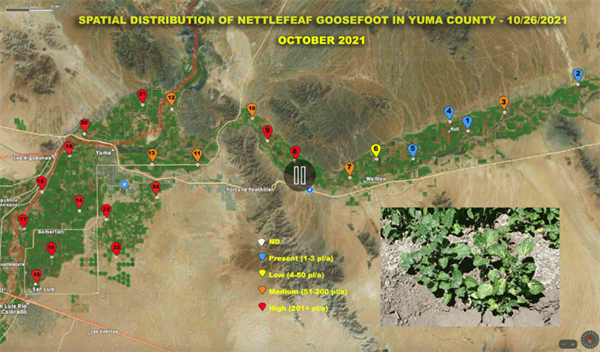
Figure 2. Nettle leaf goosefoot continues to be the most abundant weed
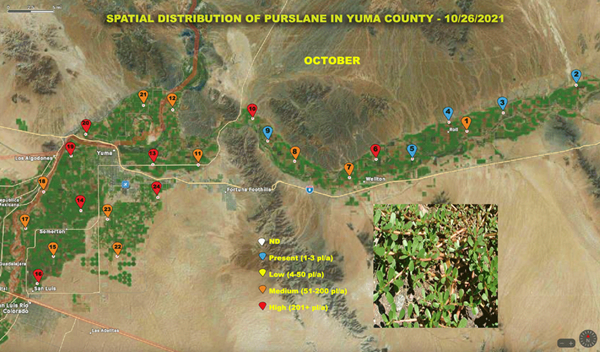
Figure 3. Purslane has been present year round around ditches and citrus orchards and alfalfa fields. With recent temperatures it is increasingly easier to detect it in our sampling points at the Yuma Valley.
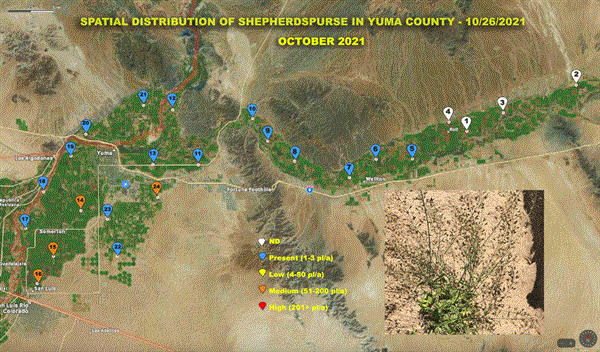
Figure 4. Shepherdspurse distribution up to February


